


















Lesson 43 of 46 · Projects and Practice
Practice Set: Twelve Epidemiology Problems
Twelve practice problems on confounding, PAF, R0, herd immunity, screening, NNT, attack rates, DALYs, ICER, bias and lead-time, with worked solutions and a checker.
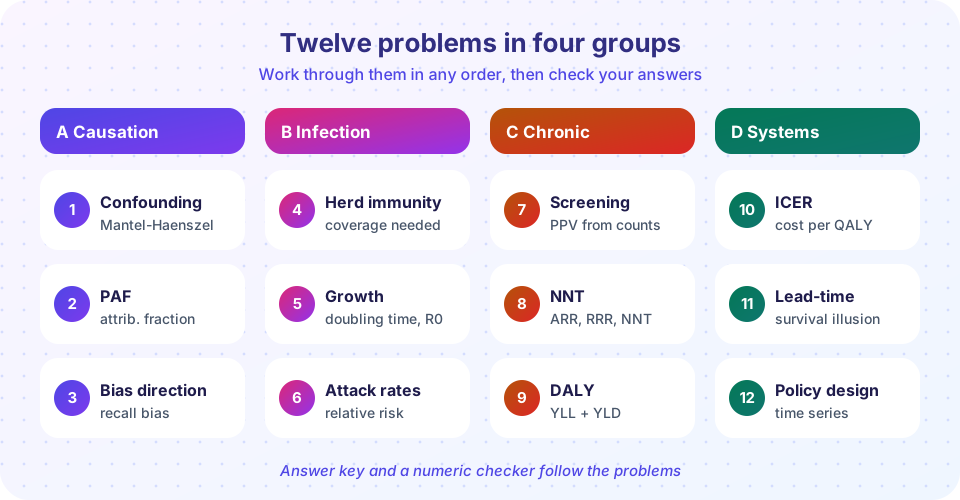
Epidemiology is learned by working with numbers and arguments. This practice set has twelve problems drawn from chapters 5 to 8: causation and bias, infectious disease, chronic disease and prevention, and health systems. Try each problem on paper first. Then check your work with the answer key and the two TryIt tools at the end.
All data are invented for practice. Round as instructed. The formulas are on the cheat sheet, and the lessons explain the reasoning.
What you will learn
- Apply the main formulas of chapters 5 to 8 to fresh numbers.
- Reason about the direction of bias and confounding in short scenarios.
- Check your own answers with code and a calculator.
Key terms
Stratum: a subgroup defined by a third variable such as age.
Mantel-Haenszel: a weighted combination of stratum-specific estimates.
PAF: population attributable fraction.
NNT: number needed to treat.
ICER: incremental cost-effectiveness ratio.
How to work through the set
Work the problems in the order you like, but follow the same routine each time. First, write down what is being asked in a short phrase (for example "adjusted risk ratio" or "coverage needed"). Second, choose the formula from the cheat sheet and write the quantities you know with their units. Third, calculate with one or two extra decimal places and round only at the end. Fourth, say in words what the number means: a result such as 87.7% is a statement about coverage of a population, and a result such as 13.1% is a statement about how often a positive test is right. Finally, ask whether the answer is plausible: a PAF cannot exceed 100%, a PPV cannot exceed 1, an NNT must be positive for a beneficial treatment.
If you get stuck, find the lesson named in the problem's group, reread its worked example and try again before looking at the answers. If your answer differs by a small amount, check rounding. If it differs by a lot, look for an error in the setup: wrong denominator, using percentages as proportions, or mixing up exposed and unexposed.
The problems
Group A: causation and bias
Problem 1 (confounding). A study of a supplement and illness has two age strata.
- Under 50: supplement users 30 ill of 300; non-users 10 ill of 100.
- 50 or older: supplement users 40 ill of 100; non-users 120 ill of 300.
Compute the crude risk ratio (users vs non-users), the stratum-specific risk ratios and the Mantel-Haenszel risk ratio. What explains the difference between crude and adjusted results?
Problem 2 (population attributable fraction). An exposure has RR = 2.5 and 30% of the population is exposed. Compute the PAF in percent (one decimal).
Problem 3 (bias direction). In a case-control study of a drug in pregnancy, mothers of babies with a malformation report medicine use more completely than mothers of healthy babies. In which direction does this bias the odds ratio, and what is it called?
Group B: infectious disease
Problem 4 (herd immunity). R0 = 6. What is the herd immunity threshold? With a vaccine that is 95% effective at preventing infection, what coverage is needed?
Problem 5 (growth). An epidemic has a doubling time of 4 days. Compute the growth rate per day, and approximate R0 if the mean generation time is 5 days using R0 = 1 + r x T_g.
Problem 6 (attack rates). At a picnic, 36 of 80 people who ate the cake became ill, and 4 of 40 who did not eat the cake became ill. Compute both attack rates and the relative risk.
Group C: chronic disease and prevention
Problem 7 (screening). 20,000 people are screened for a disease with 0.5% prevalence. The test has sensitivity 90% and specificity 97%. How many true positives and false positives are there, and what is the PPV (percent, one decimal)?
Problem 8 (NNT). A drug lowers the five-year risk of a stroke from 8% to 6%. Compute the absolute risk reduction, the relative risk reduction and the NNT.
Problem 9 (DALY). A condition causes 50 deaths, each losing 30 years of standard life expectancy, and 400 people live with it for a year at a disability weight of 0.15. Compute YLL, YLD and the DALYs.
Group D: health systems and policy
Problem 10 (ICER). A program costs 12,000 more per person than current care and gains 0.4 QALYs per person. Compute the ICER. Would it be below a threshold of 25,000 per QALY?
Problem 11 (lead-time bias). With screening, a cancer is diagnosed at age 62; without screening it would have been diagnosed at age 65 when symptoms appear. In both cases the person dies at age 68. Compute the survival from diagnosis in each case and the true gain in life.
Problem 12 (policy evaluation). A city bans a harmful product in March 2022. A researcher compares injury rates in the year after the ban with the year before and finds a 15% fall. List two reasons this simple comparison may mislead, and suggest a stronger design.
Worked answers
Problem 1. Crude: users 70/400 = 17.5%; non-users 130/400 = 32.5%; RR = 0.54, which suggests the supplement is protective. Under 50: 10% vs 10%, RR = 1.0. Age 50 or older: 40% vs 40%, RR = 1.0. Mantel-Haenszel: numerator = 30 x 100/400 + 40 x 300/400 = 7.5 + 30 = 37.5; denominator = 10 x 300/400 + 120 x 100/400 = 7.5 + 30 = 37.5; RR = 1.00. Explanation: age is a confounder. Older people were much more often non-users (300 of the 400 non-users were 50 or older, against 100 of the 400 users) and older people were far more likely to be ill (40% against 10%), so non-users looked sicker. Within each age group there is no association.
Problem 2. PAF = 0.3 x 1.5 / (1 + 0.3 x 1.5) = 0.45 / 1.45 = 0.310, so 31.0%.
Problem 3. Recall bias, a differential misclassification. Cases remember exposures better, so exposure is over-reported among cases and the odds ratio is biased away from the null (upward).
Problem 4. Threshold = 1 - 1/6 = 83.3%. Coverage = 0.833 / 0.95 = 87.7%.
Problem 5. r = ln 2 / 4 = 0.173 per day. R0 is about 1 + 0.173 x 5 = 1.87.
Problem 6. Attack rate among those who ate = 36/80 = 45%; among those who did not = 4/40 = 10%; RR = 4.5.
Problem 7. Diseased = 100; TP = 90; FN = 10. Healthy = 19,900; FP = 19,900 x 0.03 = 597; TN = 19,303. PPV = 90 / (90 + 597) = 13.1%.
Problem 8. ARR = 8% - 6% = 2 percentage points; RRR = 2/8 = 25%; NNT = 1/0.02 = 50.
Problem 9. YLL = 50 x 30 = 1,500. YLD = 400 x 0.15 x 1 = 60. DALYs = 1,560.
Problem 10. ICER = 12,000 / 0.4 = 30,000 per QALY. That is above the threshold of 25,000, so it would not be considered cost-effective at that threshold (other factors such as severity and equity may still matter).
Problem 11. With screening: survival from diagnosis = 68 - 62 = 6 years. Without: 68 - 65 = 3 years. Apparent gain = 3 years, but the person dies at the same age, so the true gain in life is 0 years: this is lead-time bias (the lead time is 3 years).
Problem 12. Possible reasons: (a) a downward trend that was already under way (regression to the mean, secular trends); (b) another change at the same time (weather, enforcement, a pandemic); (c) a one-year window may be a random fluctuation. A stronger design is an interrupted time series with many months before and after the ban, ideally with a comparison city without a ban (controlled ITS or difference-in-differences).
Try it
First, a Python script that solves the numerical problems. Compare it with your own answers; edit the inputs to make new variations of the same questions.
Press Run (or Ctrl + Enter) to see the result here.
Program input · what you'd type while the program runs
Type the answers before you press Run, one per line. Each time the program reads a line (with input()), it gets the next line from this box.
Second, an answer checker for the numeric problems. Type your answers and see which are right. A tolerance allows for rounding.
Check your understanding
Quick check · 4 questions
of 4 answered You scored / 4 · perfect!
-
1. A drug lowers risk from 10% to 7.5%. What is the NNT?
ARR = 2.5 points = 0.025, so NNT = 1/0.025 = 40. -
2. A test with sensitivity 80% and specificity 95% is applied where prevalence is 2%. Which is closest to the PPV?
Per 1,000: TP 16, FP 49; PPV = 16/65, about 25%. The closest option is 25%. -
3. If a confounder inflates a crude RR, the adjusted RR will usually be:
Removing the inflating effect of the confounder moves the estimate toward the truth, which is nearer to 1. -
4. Which design best evaluates a city-wide law when a trial is impossible?
Many time points and a control reduce the risk of mistaking trends for effects.
Summary
- Problems in epidemiology combine a formula, a table and a judgment about bias or confounding.
- Check each calculation twice and explain, in words, what the number means.
- For each numerical result, ask which direction bias might push it and how robust the conclusion is.
- Use the answer key and checker for feedback, then invent variations by changing the numbers.
Next: Epidemiology glossary
Track your progress
Create a free account to tick off lessons and pick up where you left off on any device.
of Public Health and Epidemiology lessons completed