


















Lesson 41 of 47 · Projects and Practice
Project 1: analyze a day of eating
Build a small food table in Python, total the nutrients in a day's menu, compare them with reference intakes, find the gaps and test improvements.
Everything in this course so far has been explanation. Now you will practice what nutrition scientists and dietitians do every day: take a record of what someone ate, turn it into nutrient numbers and compare those numbers with reference intakes. You will build the tools yourself in Python, which makes the logic transparent: a diet analysis is just a table of foods, multiplication and a comparison. The same method underlies professional software, which uses much larger food composition databases.
Educational exercise only. The menu, the target values and the results are for practice. They are not a diagnosis or a personal dietary prescription, and a real assessment needs more than one day of data and a trained professional.
What you will learn
- How to turn a menu into nutrient totals using a food composition table.
- How to express intakes as a percentage of reference intakes and spot gaps.
- How to calculate the share of energy from carbohydrate, protein and fat.
- How to test changes to the menu and see their effect.
Key terms
- Food composition table: a database giving nutrients per 100 g of each food.
- Percent of reference intake: total nutrient divided by the target, times 100.
- Nutrient density: nutrients per kilocalorie.
- Dietary record: a written log of food eaten, with weights or portion sizes.
- Under-reporting: forgetting or leaving out foods, one of the main sources of error in diet studies.
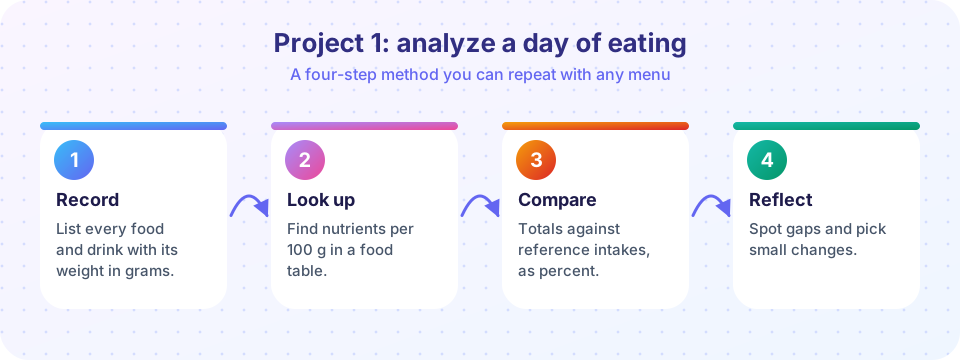
Step 1 and 2: record and look up
A diet record lists each food with an amount in grams. The food table gives nutrients per 100 g, so for each food you multiply by grams / 100. The values below are rounded approximations taken from standard food composition tables (such as USDA FoodData Central), good enough for learning but not for clinical use, because brands, varieties and cooking methods change them.
Our example person is a 25-year-old woman, and the reference intakes are rounded US/Canada values for adult women aged 19-30 on a 2,000 kcal reference diet: protein 46 g (RDA), fiber 25 g (AI), calcium 1,000 mg, iron 18 mg, vitamin C 75 mg, and sodium under 2,300 mg (the upper-limit style target, so more is not better).
Press Run (or Ctrl + Enter) to see the result here.
Program input · what you'd type while the program runs
Type the answers before you press Run, one per line. Each time the program reads a line (with input()), it gets the next line from this box.
Step 3: compare and interpret
Run the analyzer and read the output the way a dietitian would:
- Energy. Is the total close to the person's estimated needs (see chapter 5)? One day says little; averages over several days are far more informative because intake varies from day to day.
- Macronutrient shares. Compare the energy split with the acceptable ranges: carbohydrate 45-65 percent, fat 20-35 percent and protein 10-35 percent of energy. Staying inside the ranges is consistent with adequate nutrition and lower chronic disease risk, but there is no single perfect split (see the plans in the next project).
- Targets. For nutrients with an RDA or AI, reaching 100 percent means the day met the recommendation; a single day below target does not mean deficiency, because the targets are meant as average intakes over time. For sodium, the aim is to stay below the limit.
- Gaps and excesses. Look for the nutrients furthest below target (in many diets: fiber, iron, vitamin D, potassium) and the ones above (sodium, added sugar, saturated fat).
- Quality beyond numbers. The table does not capture how processed foods are, how filling they are, or what they displace. Chips and cola supply energy and sodium but little else, which is what nutrient density measures.
For the example menu the analyzer reports about 1,900 kcal, with roughly half of the energy from carbohydrate, a fifth from protein and 30 percent from fat. Protein, fiber and vitamin C pass their targets, calcium reaches about 83 percent and iron is the lowest, at about 58 percent. Sodium is low only because the record has no added salt, and real days usually include more. A dietitian would note iron as the gap to examine, remembering that the target of 18 mg is high because of menstrual losses and that one day is not a verdict.
Step 4: reflect and test changes
Real advice is about practical swaps, not lecturing. Try replacing the chips and cola in the menu with lentils, an orange and water, then compare. The second program prints the before and after side by side so that you can see which nutrients change most.
Press Run (or Ctrl + Enter) to see the result here.
Program input · what you'd type while the program runs
Type the answers before you press Run, one per line. Each time the program reads a line (with input()), it gets the next line from this box.
Limitations to discuss
Every diet analysis has errors, and part of the skill is knowing them:
- Recording error. People forget snacks, drinks and added oil; under-reporting of 10-30 percent of energy is common in studies.
- Table error. Values are averages; a brand of bread or a cooking method can change sodium or fat several-fold.
- Portion estimation. Without weighing, portions are guesses.
- One day is not a diet. Day-to-day variation is large, so assessments use several days or food frequency questionnaires.
- Supplements and fortified foods change totals and are often missed.
- Targets are for groups. An individual who falls short may still be well nourished; clinical signs and blood tests are needed to diagnose deficiency.
Extension ideas
- Add five foods from your own diet to the table (copy values from a national food composition database, noting the source).
- Add potassium, vitamin D and saturated fat, and set targets from the DRI explorer.
- Compute a "nutrient density" score: nutrients per 100 kcal for each food and rank the foods.
- Run the analysis for a three-day menu and average the days.
A note on food composition databases
Real diet analysis software draws on databases with thousands of foods: USDA FoodData Central in the United States, McCance and Widdowson's tables in the UK, and national tables elsewhere. Each entry is an average from laboratory analysis of several samples, and different countries analyze different varieties and recipes. Two databases can disagree on the same food by a few percent for energy and by much more for nutrients like vitamin C, which depends on storage and cooking, or sodium, which depends on the brand. When you move from this practice table to a real tool, read the documentation: it says which foods are analyzed, which are calculated from recipes and how missing values are handled. Good professionals note the source and version in every report so that results can be reproduced.
Check your understanding
Quick check · 5 questions
of 5 answered You scored / 5 · perfect!
-
1. How do you compute the nutrients from 80 g of a food listed per 100 g?
Scale by grams eaten divided by 100. -
2. For sodium, which result is the aim?
Sodium has an upper limit; the aim is to stay under it. -
3. Why is a single day's record of limited use?
Reference intakes describe average intake over time. -
4. What is nutrient density?
Dense foods supply many nutrients for few calories. -
5. A woman's iron intake is 60 percent of the RDA for one day. What is the best conclusion?
RDAs are group targets for average intake; deficiency is diagnosed by clinical assessment and tests.
Summary
- A diet analysis multiplies food amounts by food-table values, sums them and compares with reference intakes.
- Express results as percent of target and as shares of energy, and judge them over several days.
- Limits include recording errors, table averages and the group nature of targets.
- Testing swaps shows which changes matter most.
Next: Project 2: planning meals around energy and macronutrients
Track your progress
Create a free account to tick off lessons and pick up where you left off on any device.
of Nutrition Science lessons completed