


















Lesson 32 of 47 · Diet, Disease and Evidence
Study designs, confounding and reading risk
Learn how cohort studies, randomized trials and meta-analyses work, why confounding and measurement error mislead, and how to read relative and absolute risk.
Suppose a large study reports that people who eat more nuts live longer. Does that mean nuts protect health? It might. It might also mean that nut eaters are, on average, wealthier, more physically active and less likely to smoke. How can a researcher tell? The answer is not a single method but a ladder of designs, each with its own strengths and ways of going wrong. Knowing the ladder lets you decide how much weight a claim deserves.
What you will learn
- How cohort, case-control, cross-sectional and randomized designs differ.
- What confounding, reverse causation and measurement error are, with examples.
- Why randomized trials in nutrition are valuable and also limited.
- How to translate relative risk into absolute risk.
Key terms
- Exposure and outcome: the thing being studied (a food, a nutrient) and the result (a disease, a lab value).
- Cohort study: follows a group over time and compares those with different exposures.
- Randomized controlled trial (RCT): participants are randomly assigned to different diets or interventions.
- Confounding: a third factor that is related to both the exposure and the outcome and distorts the association.
- Relative risk (RR): the risk in one group divided by the risk in another.
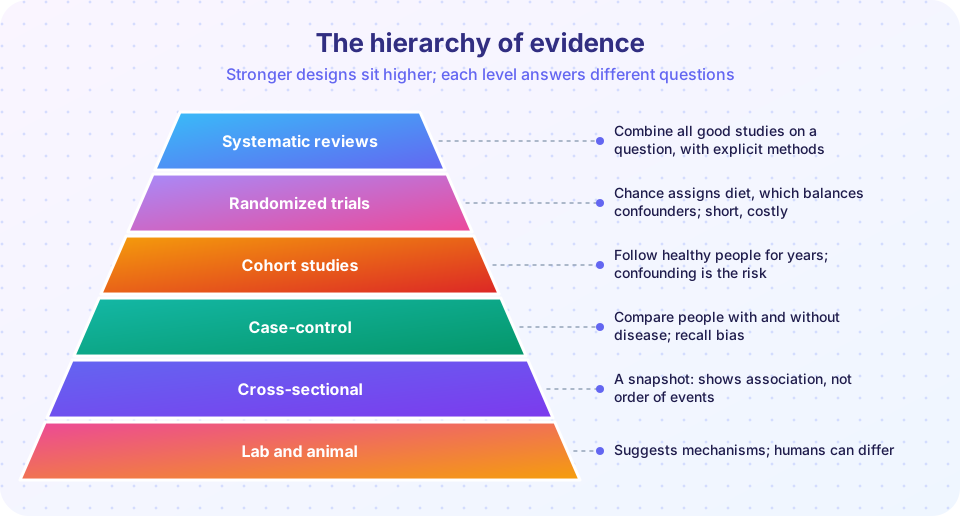
The main designs
Ecological and cross-sectional studies compare populations or take a snapshot at one time. The Seven Countries Study, which Ancel Keys began in 1958, compared diets and heart disease across communities in several countries and helped launch the diet-heart hypothesis. Such studies generate ideas but cannot show that diet came first or rule out other national differences.
Case-control studies start with people who have a disease (cases) and match them to people who do not (controls), then ask about past diet. They are efficient for rare diseases, but memory is imperfect and people with a disease may remember differently (recall bias).
Cohort studies start with healthy people, record their diets and follow them for years. The Nurses' Health Study, which began in 1976 and has followed hundreds of thousands of health professionals in successive cohorts, is among the best known. Cohorts measure exposure before disease occurs and can study many outcomes, but they are observational: people choose their own diets.
Randomized controlled trials assign people to a diet by chance. Randomization spreads known and unknown confounders evenly between groups, so any difference in outcome can be credited to the intervention. That is the key advantage. In nutrition, trials face real obstacles: participants know what they eat, adherence slips, groups drift toward each other, and trials last years rather than decades. Notable examples include:
- The Women's Health Initiative Dietary Modification Trial (about 48,000 postmenopausal women, 8 years). It tested a lower-fat, higher-fruit-and-vegetable diet and found small, mostly non-significant differences in breast cancer and heart disease. One limit was that the intervention group cut fat much less than planned, so the contrast was modest.
- PREDIMED (Spain, about 7,400 people at high cardiovascular risk, nearly 5 years) randomized people to a Mediterranean diet supplemented with extra-virgin olive oil or nuts, or to advice to reduce fat. The Mediterranean groups had roughly 30 percent fewer major cardiovascular events. In 2018 the authors retracted and republished the paper after finding that randomization had not been done properly at some sites; a reanalysis that removed those participants gave very similar results. The episode is a good lesson in how scrutiny improves the science.
Systematic reviews and meta-analyses collect all relevant studies by an explicit, reproducible method and combine them. They are only as good as the studies they include and can inherit all their biases.
A strong design is not a guarantee. A large, well-conducted cohort can be more informative than a small, poorly executed trial, and for harm that cannot be tested ethically (such as smoking), observational evidence is the only kind we will ever have.
Confounding: the central trap
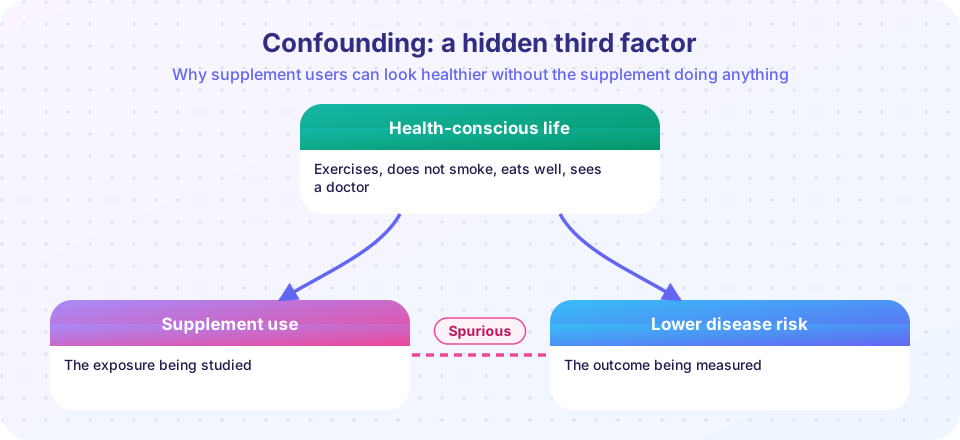
Imagine people who take a supplement have 30 percent fewer heart attacks in a cohort. Perhaps they also exercise more, smoke less and see doctors more often. If so, the supplement looks protective because it is a marker of a healthy lifestyle. Researchers address this by adjusting for measured confounders in the analysis, but some are always unmeasured or poorly measured, leaving residual confounding. The classic example is hormone replacement therapy in women: observational studies suggested protection against heart disease, partly because women who used it were healthier and wealthier, while the randomized WHI trial found no protection and some increased risks.
The simulation below creates a world in which a supplement does nothing, but "health-conscious" people use it more often and have lower disease risk. See how a crude comparison reveals a spurious effect that disappears within groups.
Press Run (or Ctrl + Enter) to see the result here.
Program input · what you'd type while the program runs
Type the answers before you press Run, one per line. Each time the program reads a line (with input()), it gets the next line from this box.
Other biases to know:
- Reverse causation. A person with early, undiagnosed illness may lose appetite or change their diet, making a food look harmful or protective when the disease came first. Studies reduce this by ignoring the first years of follow-up.
- Measurement error. Food frequency questionnaires are imprecise; random error usually weakens (biases toward zero) real associations, while systematic error such as under-reporting by people with obesity can distort them.
- Healthy-user and healthy-adherer bias. People who follow advice and take pills as directed tend to be healthier in other ways, which appeared even among people taking placebo in trials.
- Selection and attrition. Who joins and who drops out may differ by diet and health.
- Publication bias and "p-hacking". Studies with exciting results are more likely to be published, and testing many foods against many outcomes produces some false positives.
Epidemiologists consider several lines of evidence together, such as the Bradford Hill considerations (1965): strength of association, consistency across studies, temporality (cause before effect), a dose-response gradient, biological plausibility, and experimental evidence. Newer tools such as Mendelian randomization, which uses genetic variants that influence an exposure as natural randomization, offer further ways to test causality.
Reading risk numbers
News stories often report relative risk: "bacon raises cancer risk by 18 percent". What that means for you depends on the absolute risk, the baseline chance of the disease.
relative risk = risk with exposure / risk without exposure
absolute risk increase = risk with exposure - risk without exposure
number needed to harm (NNH) = 1 / absolute risk increase
For an illustrative disease with a lifetime risk of 5 percent, an 18 percent relative increase raises it to about 5.9 percent, an extra 0.9 in 100 people. The same 18 percent applied to a disease of 0.1 percent baseline risk is only an extra 0.018 in 100. Always ask: 18 percent of what? Another distinction: a risk estimate describes a group, not a certainty for any one person.
Press Run (or Ctrl + Enter) to see the console output here.
No output.
Common misconceptions
- "Observational studies are worthless." They are essential, especially for long-term and harmful exposures; they just need careful reading.
- "An RCT always settles it." A trial that tests a short, small or poorly adhered diet can mislead as well.
- "If an association is statistically significant, it is real and important." Significance is about chance, not effect size, confounding or importance.
- "A 50 percent increase in risk is a big danger." Check the baseline risk.
Check your understanding
Quick check · 6 questions
of 6 answered You scored / 6 · perfect!
-
1. What does randomization achieve in a trial?
Chance assignment makes groups comparable at the start. -
2. A baseline risk is 2 in 100 and the relative risk is 1.5. What is the exposed group's absolute risk?
2 x 1.5 = 3 in 100, an absolute increase of 1 in 100. -
3. Why did hormone therapy look protective in observational studies but not in the WHI trial?
Users were healthier at baseline, which observational adjustment could not fully remove. -
4. What is reverse causation?
Illness can alter eating before it is diagnosed. -
5. Which design starts with people who have a disease and looks back at their diet?
Case-control studies compare past exposures of cases and controls. -
6. What happened with the original PREDIMED paper?
The 2018 reanalysis excluded irregularly randomized participants and found a similar benefit.
Summary
- Designs run from ecological and case-control studies through cohorts and RCTs to meta-analyses; each has typical biases.
- Confounding, reverse causation, measurement error and healthy-user bias explain many contradictory headlines.
- RCTs are powerful but hard in nutrition; trials and cohorts together build the case.
- Always convert relative risk to absolute risk.
Track your progress
Create a free account to tick off lessons and pick up where you left off on any device.
of Nutrition Science lessons completed