


















Lesson 24 of 46 · Stocks and Valuation
Valuation Multiples: P/E, P/B, P/S and EV/EBITDA
Learn the most used valuation multiples, how to compare a company with its peers, and the traps that make a cheap-looking ratio misleading.
A share price alone tells you nothing, but a share price divided by something tells you a lot. A valuation multiple scales the price (or the value of the whole business) by a measure of what the business earns, owns or sells. The result is a single number that can be compared across companies, across industries and across time. Multiples are fast, which is why analysts reach for them first, and they are easy to misuse, which is why this lesson spends as much time on the traps as on the formulas.
We continue with the invented Brightwater Coffee Roasters from the previous lesson. Its shares trade at 18.00, and it has 100 thousand shares outstanding, so its market capitalization (price times shares) is 1,800 thousand.
What you will learn
- How to compute and read P/E, price-to-book, price-to-sales, EV/EBITDA and dividend yield.
- What enterprise value is and why it fixes a weakness of equity-only multiples.
- How to run a peer comparison and turn a peer multiple into an implied price.
- Why growth, cyclicality and accounting differences can make a multiple lie.
Key terms
Multiple: a price or value divided by a financial measure such as earnings or sales.
Market capitalization: share price multiplied by the number of shares outstanding.
Enterprise value (EV): market capitalization plus debt minus cash; the price of the whole operating business.
EBITDA: earnings before interest, taxes, depreciation and amortization, a rough proxy for operating cash earnings.
Peer group: companies in the same industry with similar growth and risk.
The price-to-earnings ratio
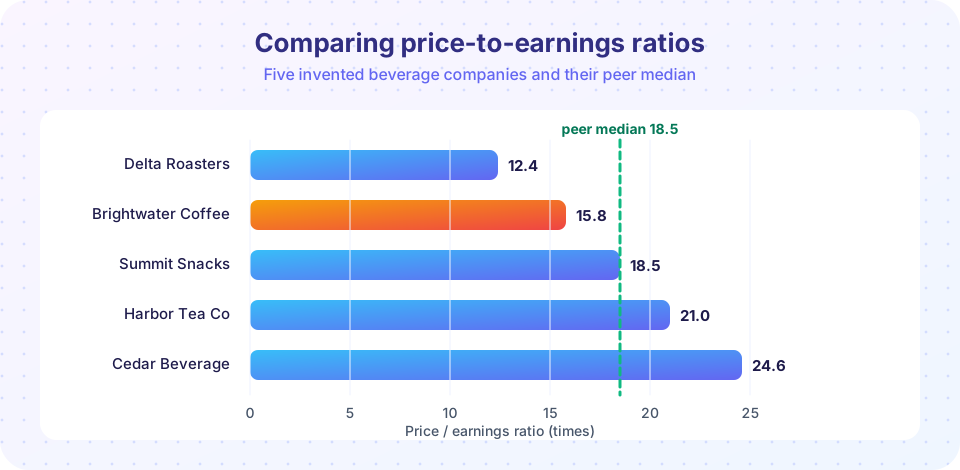
The P/E ratio is price per share divided by earnings per share. Brightwater earns 1.14 per share, so its P/E is 18.00 / 1.14 = 15.8. Read it as "investors pay 15.8 dollars for each dollar of yearly profit." Turned upside down it is the earnings yield: 1.14 / 18.00 = 6.3 percent, the profit the business generates per dollar of share price, which is a handy way to compare with the interest on a bond.
A trailing P/E uses the last twelve months of actual earnings. A forward P/E uses analysts' forecasts for the next year; it is more relevant for valuation and also more uncertain. A high P/E usually signals that investors expect strong growth or low risk, a low P/E the opposite. It can also signal that earnings are temporarily high, which is the trap discussed below.
Other common multiples
Price-to-book (P/B) divides price by equity per share. Brightwater's equity is 500, so book value per share is 5.00 and P/B is 18.00 / 5.00 = 3.6. P/B is popular for banks and insurers, whose assets are financial and measured near market prices, and weak for companies whose value lies in brands, software or people, which the balance sheet barely records.
Price-to-sales (P/S) divides market capitalization by revenue: 1,800 / 1,200 = 1.5. It works for young companies with no profits yet, but it ignores profitability entirely: a business with 1 percent margins and one with 20 percent margins can show the same P/S.
Enterprise value to EBITDA (EV/EBITDA) deals with a flaw of P/E: two companies with identical operations but different debt show different P/E ratios. Enterprise value adds the debt that financiers have lent and subtracts the cash that could repay it, so it prices the operating business independent of how it is financed.
EV = market cap + debt - cash
For Brightwater, debt is 390 and cash is 150, so EV = 1,800 + 390 - 150 = 2,040. EBITDA is operating income 180 plus depreciation 40, which is 220, so EV/EBITDA = 2,040 / 220 = 9.3. Because EBITDA ignores differences in depreciation policy and capital structure, EV/EBITDA is the standard multiple for comparing companies in capital-heavy industries and for takeover analysis. Its weakness is that EBITDA ignores the capital spending a business must make to keep running.
Dividend yield is dividends per share divided by price: 0.30 / 18.00 = 1.7 percent. The payout ratio is dividends divided by earnings: 0.30 / 1.14 = 26 percent, so most profit is kept inside the business.
PEG divides the P/E ratio by the expected growth rate in percent. If Brightwater is expected to grow earnings 9 percent a year, PEG = 15.8 / 9 = 1.75. The idea is to adjust for the fact that faster growers deserve higher P/E ratios. It is a rough rule of thumb, since growth estimates are noisy and growth does not last forever.
Relative valuation step by step
Relative valuation (also called comparable analysis, or "comps") asks what a company would be worth if the market valued it like its peers.
- Pick the peer group. Same industry, similar size, growth and risk. Four to ten companies is typical.
- Choose the multiple. P/E for steady profitable firms, EV/EBITDA for capital-heavy or differently financed firms, P/S for companies with no profits.
- Compute the multiple for each peer and take the median, which resists one odd company.
- Apply it to the target. Brightwater's EPS of 1.14 times the peer median P/E of 18.5 gives an implied price of 21.09, about 17 percent above the market's 18.00.
- Ask why. Is the gap an opportunity or does it reflect real differences? If Brightwater grows more slowly or has a weaker brand than its peers, it deserves a lower multiple.
Step five is the one that separates analysis from arithmetic. A gap between a company's multiple and its peers' is a question, not an answer.
Why multiples mislead
Growth. A company growing earnings at 15 percent a year can justify a higher P/E than one growing at 3 percent, because its earnings will be much larger in a few years. The second Try it example shows how peer P/E ratios usually rise with growth.
Cycles. Earnings of a steel maker, an airline or a homebuilder swing with the economy. At the peak of the cycle earnings are huge and the P/E looks very low, just before profits collapse; at the bottom the P/E looks very high. Economist Robert Shiller proposed averaging ten years of inflation-adjusted earnings to smooth the swings, which gives a measure known as CAPE. The third example imitates the effect.
Accounting differences. Depreciation methods, inventory rules and one-off charges change reported earnings. Check that you are comparing like with like.
Negative or tiny earnings. A P/E is meaningless when earnings are negative and enormous when they are close to zero.
Cheap for a reason. A low multiple can mean the market expects a decline. Investors call a stock that looks cheap but keeps getting cheaper a value trap.
Common misconceptions
"A low P/E means undervalued." It may mean that earnings are about to fall, that growth is poor, or that risk is high.
"The market average P/E is the right P/E for every stock." Fair multiples depend on growth, risk and interest rates, which differ from company to company and change over time.
"EV/EBITDA is cash flow." EBITDA leaves out capital spending, taxes and working capital; a company can have strong EBITDA and negative free cash flow.
Try it
First, a peer table. Change any price or earnings figure and watch the median and Brightwater's implied price move. All companies are invented.
Press Run (or Ctrl + Enter) to see the result here.
Program input · what you'd type while the program runs
Type the answers before you press Run, one per line. Each time the program reads a line (with input()), it gets the next line from this box.
Second, the link between growth and the P/E ratio, with a straight line fitted through the five points.
Press Run (or Ctrl + Enter) to see the result here.
Program input · what you'd type while the program runs
Type the answers before you press Run, one per line. Each time the program reads a line (with input()), it gets the next line from this box.
Third, how a cyclical company's P/E changes depending on which year's earnings you use.
Press Run (or Ctrl + Enter) to see the result here.
Program input · what you'd type while the program runs
Type the answers before you press Run, one per line. Each time the program reads a line (with input()), it gets the next line from this box.
Check your understanding
Quick check · 5 questions
of 5 answered You scored / 5 · perfect!
-
1. A company earns 2.00 per share and its shares cost 30.00. What is its P/E ratio and earnings yield?
P/E = 30 / 2 = 15, and the earnings yield is its inverse, 2 / 30 = 6.7%. -
2. A company has market cap 500, debt 200 and cash 50. What is its enterprise value?
EV = 500 + 200 - 50 = 650. -
3. Why is EV/EBITDA better than P/E for comparing two firms with different debt levels?
Enterprise value includes debt and subtracts cash, so financing choices matter less. -
4. A cyclical company's P/E looks very low at the top of its earnings cycle. What is the likely danger?
Peak earnings flatter the ratio; averaging several years gives a better picture. -
5. Which is the best next step after finding that a stock trades below its peer median P/E?
A gap versus peers is a question to investigate, not an answer.
Summary
- A multiple divides price (or enterprise value) by earnings, book value, sales or EBITDA so companies can be compared.
- EV = market cap + debt - cash; EV/EBITDA neutralizes capital structure.
- Relative valuation applies a peer median multiple to the target and then asks why any gap exists.
- Growth, cycles, accounting differences and tiny earnings all distort multiples.
Track your progress
Create a free account to tick off lessons and pick up where you left off on any device.
of Investing and Markets lessons completed