


















Lesson 30 of 46 · Bonds and Fixed Income
The Yield Curve and Credit Risk
Understand normal, flat and inverted yield curves, spot and forward rates, credit ratings, spreads and expected loss, with runnable calculations.
So far we discounted every cash flow of a bond at one yield. Real markets quote a different yield for every maturity, and a different yield again for every borrower. The first variation is the yield curve; the second is credit risk. Together they explain why two bonds that both mature in ten years can offer very different returns, and why the shape of the curve is watched as a signal about the economy.
What you will learn
- What the yield curve is and what normal, flat and inverted shapes suggest.
- How spot rates and forward rates relate, and how to compute a forward rate.
- How credit ratings, spreads, default probability and recovery fit together.
- How to estimate expected loss and compare it with a spread.
Key terms
Yield curve: a plot of yields against maturity for bonds of similar credit quality, usually government bonds.
Spot rate: the yield on a zero-coupon bond for a given maturity.
Forward rate: the interest rate implied today for a loan that starts in the future.
Credit spread: the yield of a risky bond minus the yield of a government bond of the same maturity.
Loss given default (LGD): the fraction of the bond's value lost if the issuer defaults; one minus the recovery rate.
The shape of the curve
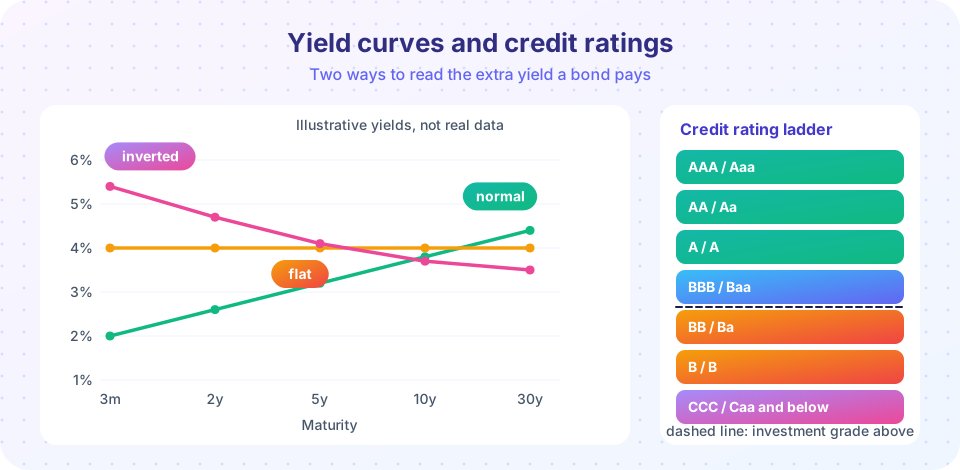
Plot the yields of government bonds against their maturities and you get the yield curve. Three shapes are common.
- Normal (upward sloping). Longer maturities yield more. This is the usual case: lenders want extra reward for locking money away and for bearing more price risk.
- Flat. Yields are similar at all maturities, often a transition between the other shapes.
- Inverted. Short-term yields exceed long-term yields. This happens when central banks have raised short rates high or when investors expect rates to fall because they expect a weaker economy. In several past US cycles an inverted curve has come before a recession, but the link is not a law and the timing has varied widely.
Why does the curve take these shapes? The expectations view says long yields are roughly the average of expected future short rates: if people expect rates to rise, the curve slopes up. The term premium view adds that long bonds carry extra price risk, so they should pay more than the expectations alone imply. Both ideas are partly right, and what you see on the screen is a mixture.
Spot rates and forward rates
The yield to maturity of a coupon bond is a kind of average that mixes different periods. A cleaner object is the spot rate s_n: the annual rate for a single payment n years from now. A cash flow C at year n is worth C / (1 + s_n)^n. A coupon bond is then a bundle of zero-coupon bonds, each discounted at its own spot rate.
If the one-year spot rate is 3 percent and the two-year spot rate is 3.5 percent, what rate does the market imply for borrowing in year two? Investing for two years at the spot rate must give the same result as investing one year and then rolling over at the one-year forward rate f:
(1 + s_2)^2 = (1 + s_1) x (1 + f), so f = (1.035)^2 / 1.03 - 1, which is 4.00 percent.
This forward rate is what the curve implies about future short rates. It is not a forecast: it is the rate you could lock in today. A rising curve implies forward rates higher than today's spot rates, a falling curve the reverse.
Spot rates are not directly quoted for all maturities, but you can recover them from the prices of coupon bonds by bootstrapping: start with the shortest bond to find s_1, use it to find s_2 from the two-year bond, then continue. The first example below does it for par bonds.
Credit ratings
Rating agencies such as S&P, Fitch and Moody's grade issuers by their ability to pay. On the S&P and Fitch scale the top grade is AAA, followed by AA, A and BBB; below BBB come BB, B and the CCC range and lower. Moody's uses Aaa, Aa, A, Baa, Ba, B, Caa and lower. Bonds rated at least BBB- (Baa3 at Moody's) are called investment grade; those below are high yield, or "speculative grade". The line matters because many pension funds and insurers may hold only investment-grade debt, so a downgrade across it can force selling.
Ratings are opinions, not guarantees. Agencies have misjudged risk before, notably on securities backed by US mortgages before 2008, so investors treat ratings as one input among several.
Spreads, default and recovery
A corporate bond yields more than a government bond of the same maturity. The difference is the credit spread. Part of the spread pays for expected losses from default. The rest pays for the uncertainty about those losses, for the bond being harder to sell, and for other risks.
Expected annual loss is roughly
expected loss = probability of default x loss given default
Suppose an invented bond has a 2 percent chance of default in a year and, if it defaults, bondholders recover 40 percent of value on average. Then LGD is 60 percent and the expected loss is 0.02 x 0.60 = 1.2 percent per year. If the bond's spread is 3 percent, about 1.2 percentage points compensate for the average loss and 1.8 points are compensation for risk and illiquidity: this excess is the reward for bearing the risk, but it is only earned on average, not every year. In a recession defaults jump and spreads usually widen, so the lowest-rated bonds can lose a lot of value at the worst time. Remember that default and recovery numbers here are examples, not market data.
Putting it together
A bond's yield can be viewed as a sum:
yield = risk-free rate for that maturity + credit spread
The risk-free part follows the yield curve and moves with central bank policy and growth expectations. The spread follows the issuer's creditworthiness and market mood. A bond fund manager decides how much of each risk to take: duration (exposure to the curve) and credit (exposure to spreads). Those are separate choices.
Common misconceptions
"An inverted curve always means a recession is coming." It has often preceded recessions, but it is a probabilistic signal with variable timing, not a rule.
"A forward rate is a prediction." It is a rate implied by today's prices that can be locked in; future spot rates can differ.
"A high spread is free money." Part of it covers expected losses, and the rest is a reward for risks that sometimes materialize.
Try it
First, bootstrap spot rates from par-bond yields and compute the forward rates they imply. Par bonds price at 1,000, so each equation can be solved for one new spot rate.
Press Run (or Ctrl + Enter) to see the result here.
Program input · what you'd type while the program runs
Type the answers before you press Run, one per line. Each time the program reads a line (with input()), it gets the next line from this box.
Second, an expected-loss table: change the default probability and recovery rate to see how much of a spread covers losses.
Press Run (or Ctrl + Enter) to see the result here.
Program input · what you'd type while the program runs
Type the answers before you press Run, one per line. Each time the program reads a line (with input()), it gets the next line from this box.
Third, draw government and corporate curves, then widen the spreads as in a stressed market.
Press Run (or Ctrl + Enter) to see the result here.
Program input · what you'd type while the program runs
Type the answers before you press Run, one per line. Each time the program reads a line (with input()), it gets the next line from this box.
Check your understanding
Quick check · 5 questions
of 5 answered You scored / 5 · perfect!
-
1. The 1-year spot rate is 4% and the 2-year spot rate is 5%. What is the implied one-year rate starting a year from now?
f = 1.05^2 / 1.04 - 1 = 1.1025 / 1.04 - 1 = 6.01%. -
2. An inverted yield curve means
Inversion is short yields above long yields. -
3. Which rating separates investment grade from high yield on the S&P scale?
BBB- is the lowest investment-grade rating; BB+ and below are speculative grade. -
4. A bond has a 3% chance of default per year and a recovery rate of 50%. What is its expected annual loss?
LGD = 50%, so 0.03 x 0.50 = 1.5%. -
5. A credit spread is best defined as
It is the extra yield investors require for credit risk and related risks.
Summary
- The yield curve plots yield against maturity; normal, flat and inverted shapes reflect expectations and term premiums.
- Spot rates discount single cash flows; forward rates are implied future rates, found from spot rates.
- Ratings from AAA down to default separate investment grade (BBB- and above) from high yield.
- Credit spread covers expected loss (probability of default times loss given default) plus a risk and liquidity premium.
Next: Chapter review
Track your progress
Create a free account to tick off lessons and pick up where you left off on any device.
of Investing and Markets lessons completed