


















Lesson 12 of 46 · Risk, Return and Diversification
Returns and volatility: measuring gain and uncertainty
Learn to calculate returns, the difference between arithmetic and geometric averages, standard deviation as volatility, annualizing, drawdown and the bell curve's limits.
"The stock did well" and "the stock is risky" are statements everyone makes and few can quantify. This lesson gives you the standard tools. You will calculate a return correctly, average a series of returns without fooling yourself, measure volatility with the standard deviation, and read the famous bell curve that turns a standard deviation into a probability. You will also learn where that curve lies to you.
What you will learn
- How to compute a simple return and a multi-period return.
- Why the compound (geometric) average is lower than the arithmetic average.
- How to compute and annualize standard deviation.
- What a drawdown is, and how the 68-95-99.7 rule helps and misleads.
Key terms
Simple return: (ending value + income - starting value) / starting value.
Arithmetic mean: the ordinary average of a list of returns.
Geometric mean: the constant yearly return that would give the same final result.
Standard deviation: a measure of how far returns typically deviate from their average.
Maximum drawdown: the largest peak-to-trough fall in a period.
Calculating a return
A one-period return is the gain as a fraction of what you started with. If you pay $200 for a fund unit and it ends the year at $212 after paying a $2 distribution, the return is (212 + 2 - 200) / 200 = 7%. Percentages are convenient because they let you compare a $200 investment with a $20,000 one.
For several periods, do not add returns. Multiply growth factors. A return series of +10%, -5% and +20% gives 1.10 × 0.95 × 1.20 = 1.254, a total gain of 25.4%, not the 25% you get by adding.
Two ways to average
Take five years of invented returns: +10%, -5%, +20%, -10%, +15%.
The arithmetic mean adds them and divides by 5: (10 - 5 + 20 - 10 + 15) / 5 = 6.0%. It is the best guess of what a typical single year will bring.
The geometric mean answers a different question: what constant yearly return gives the same final wealth? The growth factors multiply to 1.10 × 0.95 × 1.20 × 0.90 × 1.15 = 1.2979. The fifth root of that is about 1.0535, so the geometric mean is about 5.35% a year. If you had earned 5.35% every year, you would have reached the same final value. This is the figure that describes your actual experience, and it is always at most the arithmetic mean.
The gap between the two is the volatility drag: the more returns bounce around, the more the compound result lags the simple average. A good approximation is geometric ≈ arithmetic - σ²/2, where σ (the Greek letter sigma) is the standard deviation. With σ = 12.9% = 0.129, σ²/2 is about 0.83 percentage points, and 6.0 - 0.83 = 5.2, close to 5.35. Drag is why steady growth beats a bumpy path with the same average, and why +50% then -50% loses 25%.
Standard deviation as volatility
How far do returns typically stray from the average? Compute each year's deviation, square it, average the squares (the variance) and take the square root:
variance = Σ (return - mean)² / (n - 1)
volatility (σ) = √variance
For our five years the deviations from 6% are +4, -11, +14, -16 and +9. The squares are 16, 121, 196, 256 and 81, summing to 670. Dividing by n - 1 = 4 (the standard sample estimate) gives a variance of 167.5 and a standard deviation of about 12.9%. We square the deviations so that ups and downs do not cancel, and take the root to return to percentage units.
Volatility is usually quoted annualized. If you measure monthly returns, multiply the monthly standard deviation by √12 (about 3.46) to get the yearly figure; for daily returns of about 252 trading days a year, multiply by √252 (about 15.9). The square root appears because independent random movements add in variance, not in size. (This scaling assumes returns in different periods are unrelated, which is roughly true for liquid markets.)
Reading the bell curve
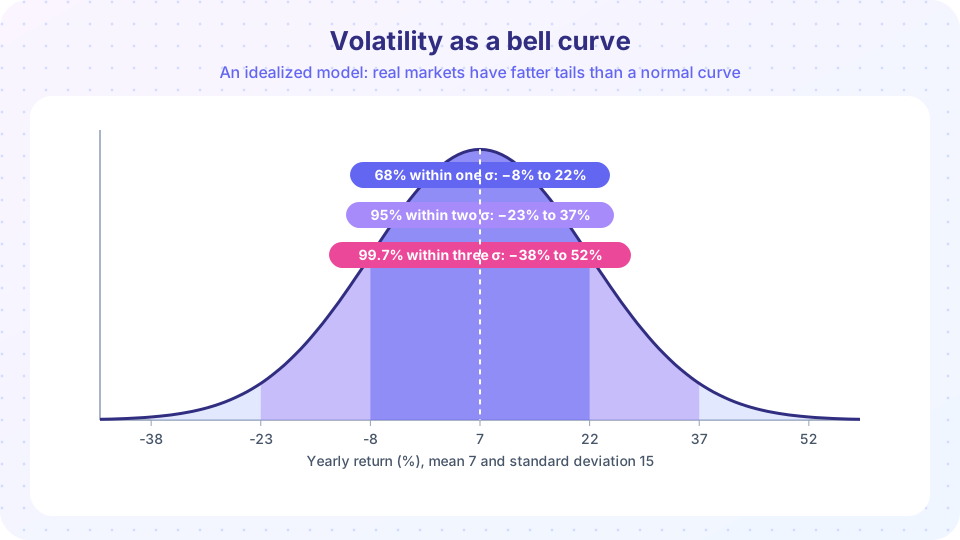
If returns follow the bell-shaped normal distribution, the standard deviation has a handy meaning, shown in the picture:
| Range | Share of years |
|---|---|
| mean ± 1σ | about 68% |
| mean ± 2σ | about 95% |
| mean ± 3σ | about 99.7% |
With a mean of 7% and σ of 15%, two years in three should fall between -8% and +22%, about 19 of 20 years between -23% and +37%, and nearly every year between -38% and +52%. This gives you a feel for what "15% volatility" means in dollars: on $10,000, a typical year might leave you anywhere from $9,200 to $12,200, and a bad but unremarkable year could cost you a quarter of it.
Where the bell curve lies
The normal distribution is a useful model with three known flaws.
- Fat tails. Real markets produce extreme days and years far more often than the curve predicts. A fall of five standard deviations should happen about once in thousands of years under the normal curve, yet markets have had such days within a single lifetime. Never treat "3σ" as "impossible".
- Skew. Stock returns have more big down moves than big up moves, so the curve is lopsided.
- Changing volatility. Calm periods and turbulent periods cluster. Last year's σ is a poor guide to next year's.
For these reasons, risk managers supplement volatility with measures focused on the downside, such as maximum drawdown: the largest percentage fall from a peak to a later low. Suppose a portfolio rises to 130, falls to 91 and recovers to 120. The drawdown is (91 - 130) / 130 = -30%. To climb back from -30% you need +42.9%, because 91 × 1.4286 = 130. Drawdowns capture what investors feel: not the standard deviation but the pain of the fall and the time it takes to recover.
Common misconceptions
"The average return is what I earn." The arithmetic average overstates the growth you actually receive; the compound (geometric) rate is the one that matches your final balance.
"Standard deviation is the maximum loss." It is a typical spread, not a limit. Losses beyond two or three standard deviations happen.
"Low volatility means safe." A low-volatility asset can still suffer inflation, credit or liquidity problems. And volatility can jump without warning.
Try it
First, a calculator for the five-year example, using plain Python so you can see every step. Then change the returns to your own.
Press Run (or Ctrl + Enter) to see the result here.
Program input · what you'd type while the program runs
Type the answers before you press Run, one per line. Each time the program reads a line (with input()), it gets the next line from this box.
Second, simulate a long run of yearly returns from a normal model and check the 68-95-99.7 rule, then compare with a fat-tailed model.
Press Run (or Ctrl + Enter) to see the result here.
Program input · what you'd type while the program runs
Type the answers before you press Run, one per line. Each time the program reads a line (with input()), it gets the next line from this box.
Check your understanding
Quick check · 5 questions
of 5 answered You scored / 5 · perfect!
-
1. Yearly returns are +10% and -10%. What is your total return over two years?
1.10 × 0.90 = 0.99, so you lose 1%. -
2. Which is always less than or equal to the arithmetic mean of the same returns?
Compounding penalizes volatility, so the geometric mean cannot exceed the arithmetic mean. -
3. A fund has a mean of 8% and a standard deviation of 12%. Under the normal model, about two years in three should fall between:
One standard deviation either side of the mean: 8 ± 12 gives -4% to +20%. -
4. Monthly returns have a standard deviation of 4%. What is the approximate annualized volatility?
Multiply by √12 ≈ 3.46: 4% × 3.46 ≈ 13.9%. -
5. A portfolio falls 20% from its peak. What gain is needed to return to the peak?
0.80 × 1.25 = 1.00, so you need +25%.
Summary
- Combine multi-period returns by multiplying growth factors, not adding percentages.
- The geometric mean matches your actual compound result and is below the arithmetic mean by roughly σ²/2.
- Volatility is the standard deviation; annualize monthly figures by √12 and daily figures by about √252.
- The normal curve's 68-95-99.7 rule is a useful guide, but real markets have fat tails; drawdown shows the pain of falls.
Track your progress
Create a free account to tick off lessons and pick up where you left off on any device.
of Investing and Markets lessons completed