


















Lesson 23 of 46 · Stocks and Valuation
Reading Financial Statements
Learn the income statement, balance sheet and cash flow statement with an invented company, and compute margins, returns, debt and free cash flow.
Every public company publishes three main financial statements, and together they are the raw material of valuation. They look dense at first, but each answers one plain question. The income statement asks: did the business make a profit over the period? The balance sheet asks: what does it own and owe at one moment? The cash flow statement asks: where did the cash actually come from and go?
This lesson follows one invented company, Brightwater Coffee Roasters, through all three, then turns the numbers into a handful of ratios that analysts use every day. All figures are in thousands of US dollars and are made up for teaching.
What you will learn
- What each of the three statements shows and how they connect.
- How to compute gross, operating and net margins, return on equity and return on assets.
- How to judge debt with the debt-to-equity ratio and interest coverage.
- Why profit and cash are different, and what free cash flow measures.
Key terms
Revenue (sales): money earned from customers during the period.
Net income: profit after every cost, interest and tax; the bottom line.
Equity: what is left for owners after liabilities are subtracted from assets.
Free cash flow (FCF): operating cash flow minus the spending needed to maintain and grow the asset base.
Earnings per share (EPS): net income divided by the number of shares.
The income statement
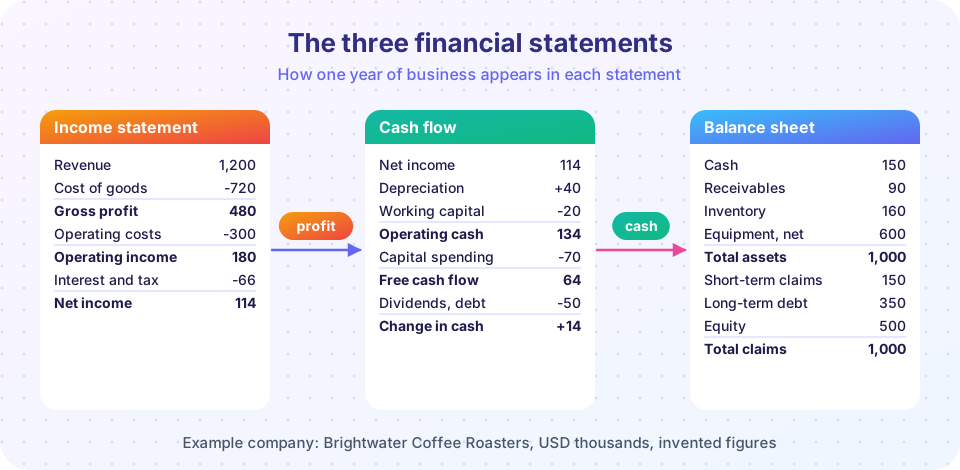
The income statement covers a period, usually a quarter or a year, and reads from the top line down. Brightwater sold coffee worth 1,200 in the year. Making the coffee (beans, roasting labor, packaging) cost 720, called the cost of goods sold. Subtracting leaves gross profit of 480, which is 40 percent of revenue.
Next come the costs of running the business that are not tied to a single bag of coffee: salaries, rent, marketing and depreciation, which spreads the cost of equipment over its useful life. Brightwater's operating costs were 300, leaving operating income (also called EBIT, earnings before interest and taxes) of 180. Operating income is the best single measure of how profitable the core business is, because it ignores how the company is financed.
The company has borrowed money, so it paid interest of 30. That leaves a pre-tax profit of 150. Tax at 24 percent takes 36, and net income is 114. With 100 thousand shares outstanding, earnings per share is 1.14.
Notice that the income statement follows accrual accounting: revenue is recorded when it is earned, and costs when they are incurred, whether or not cash has moved yet. That matches effort to reward, but it means profit is not the same as cash. The cash flow statement exists to bridge the gap.
The balance sheet
The balance sheet is a photograph at one date. It obeys an identity that never breaks:
Assets = Liabilities + Equity
Brightwater has 1,000 of assets. Current assets (cash 150, receivables 90, inventory 160) total 400 and are expected to turn into cash within a year. Equipment, net of the depreciation already taken, is 600. On the other side, 150 is owed in the short term (suppliers and short-term debt) and 350 is long-term debt, so liabilities total 500. The remainder, 500, belongs to the owners as equity.
Equity is also called book value. It is an accounting number, built from the money shareholders put in and the profits kept over the years. It is rarely what the shares are worth in the market, because it records past costs, not future earning power. A software company with few physical assets can have a small book value and an enormous market value.
The cash flow statement
The cash flow statement starts with net income and corrects it to actual cash in three blocks.
Operating activities. Start with net income, 114. Add back depreciation, 40, because it reduced profit but no cash left the building. Subtract the 20 that was tied up in extra inventory and receivables, because those are costs paid but not yet recovered. Cash from operations is 134.
Investing activities. Brightwater bought a new roaster and shelving for 70, called capital spending or capex.
Financing activities. It paid dividends of 30 and repaid 20 of debt, so 50 went out.
The net change in cash is 134 - 70 - 50 = +14, which matches the rise in the balance sheet's cash line. This is how the three statements lock together: profit feeds the cash flow statement, cash feeds the balance sheet, and retained profit increases equity.
Free cash flow is operating cash flow less capex: 134 - 70 = 64. It is the cash left over after the business has paid to keep itself running, available for dividends, debt repayment or growth. Valuation models in the next lessons are built on this figure.
Turning statements into ratios
Raw numbers are hard to compare across companies of different sizes. Ratios scale them.
| Ratio | Formula | Brightwater |
|---|---|---|
| Gross margin | gross profit / revenue | 480 / 1,200 = 40.0% |
| Operating margin | operating income / revenue | 180 / 1,200 = 15.0% |
| Net margin | net income / revenue | 114 / 1,200 = 9.5% |
| Return on equity (ROE) | net income / equity | 114 / 500 = 22.8% |
| Return on assets (ROA) | net income / total assets | 114 / 1,000 = 11.4% |
| Current ratio | current assets / current liabilities | 400 / 150 = 2.67 |
| Debt to equity | total debt / equity | 390 / 500 = 0.78 |
| Interest coverage | operating income / interest | 180 / 30 = 6.0 |
| FCF margin | free cash flow / revenue | 64 / 1,200 = 5.3% |
Margins show how much of each sales dollar survives each layer of cost. Return on equity shows the profit generated per unit of owners' money; Brightwater's 22.8 percent looks strong, but remember that borrowing raises ROE when things go well and amplifies losses when they do not, which is why ROE should always be read alongside debt. Interest coverage says how many times operating profit covers interest; a figure of 6 means a sizeable cushion, while a figure near 1 means a small drop in profit could threaten payments.
The current ratio measures short-term liquidity: can the company pay its bills due within a year? A value above 1 means yes, in principle, though a high number built on slow-selling inventory can be misleading.
Profit is not cash
A growing company can show healthy profits while running short of cash. Imagine Brightwater sells a large order on credit: revenue and profit rise immediately, but the customer pays in 90 days. In the meantime the receivable sits on the balance sheet, and the roaster still has to pay for beans and wages today. The third example below shows the effect with numbers. The warning sign analysts look for is net income that keeps rising while operating cash flow stays flat or falls, year after year.
Reading with skepticism
Statements are produced by managers under accounting rules (US GAAP or IFRS) and checked by an independent auditor, but rules leave room for judgment: how fast to depreciate equipment, when to recognize a sale, how to value inventory. Companies also publish "adjusted" figures that strip out costs they consider unusual; if the "one-off" items appear every year, they are not one-off. Useful habits are to read the notes to the accounts, compare several years rather than one, and prefer cash flow numbers when you doubt the profit numbers.
Common misconceptions
"Net income is the cash the company made." Net income includes non-cash items such as depreciation and ignores spending on equipment; free cash flow is closer to the truth.
"Book value is what the company is worth." Book value records historical accounting costs. Market value reflects expected future cash flows.
"A high ROE is always good." Heavy borrowing and tiny equity can inflate ROE; check debt and coverage too.
Try it
The first example computes every ratio in the table from the statements, so you can change a number and see the effect.
Press Run (or Ctrl + Enter) to see the result here.
Program input · what you'd type while the program runs
Type the answers before you press Run, one per line. Each time the program reads a line (with input()), it gets the next line from this box.
The second example charts three years of margins for the same invented company. Watch how a small rise in gross margin becomes a bigger rise in operating margin: that is operating leverage, because many costs do not grow as fast as sales.
Press Run (or Ctrl + Enter) to see the result here.
Program input · what you'd type while the program runs
Type the answers before you press Run, one per line. Each time the program reads a line (with input()), it gets the next line from this box.
The third example shows profit and cash drifting apart when customers pay late.
Press Run (or Ctrl + Enter) to see the result here.
Program input · what you'd type while the program runs
Type the answers before you press Run, one per line. Each time the program reads a line (with input()), it gets the next line from this box.
Check your understanding
Quick check · 5 questions
of 5 answered You scored / 5 · perfect!
-
1. Which identity always holds on the balance sheet?
What a company owns is financed either by what it owes or by the owners' stake. -
2. A company has revenue of 800, cost of goods sold of 500 and operating costs of 160. What is its operating margin?
Operating income = 800 - 500 - 160 = 140, and 140 / 800 = 17.5%. -
3. Why is depreciation added back in the cash flow statement?
Depreciation spreads the cost of equipment over time; the cash was spent when the equipment was bought. -
4. Free cash flow is best described as
FCF is the cash left after paying to maintain and expand the asset base. -
5. Interest coverage of 1.2 compared with 6.0 suggests the first company
Operating profit barely covers interest, so a small decline in profit could threaten the payments.
Summary
- The income statement shows profit for a period, the balance sheet shows what is owned and owed at a date, and the cash flow statement explains cash.
- Profit is accrual-based; free cash flow (operating cash flow minus capex) is what valuation models use.
- Margins, ROE and ROA measure profitability; debt-to-equity, interest coverage and the current ratio measure financial strength.
- Read several years, read the notes, and compare profit with cash.
Next: Valuation multiples
Track your progress
Create a free account to tick off lessons and pick up where you left off on any device.
of Investing and Markets lessons completed