


















Lesson 21 of 46 · Portfolio Theory
Chapter 4 review: portfolio theory
Review Chapter 4 of the investing course: two-asset portfolios, the efficient frontier, the Sharpe ratio, CAPM and beta, asset allocation and rebalancing, with a ten-question quiz.
Chapter 4 took you from single assets to whole portfolios. You computed the volatility of a mix, found the minimum-variance weights, located the best risky portfolio with the Sharpe ratio, priced risk with beta and turned theory into a target mix with a rebalancing rule. This review ties the chapter into a picture and a table, then checks your understanding with ten mixed questions.
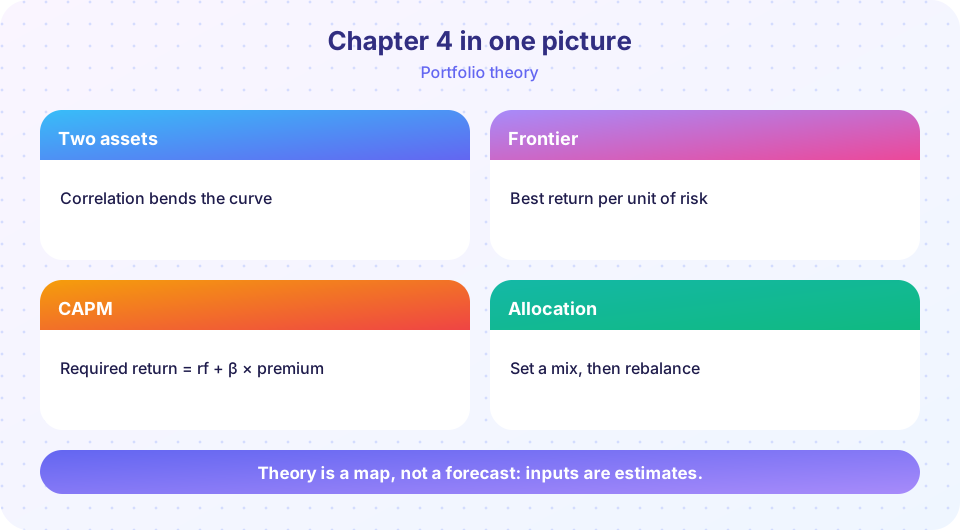
The chapter in one table
| Idea | Formula or rule | Lesson |
|---|---|---|
| Portfolio expected return | Weighted average of the assets' returns | Overview |
| Two-asset volatility | √(w²σA² + (1-w)²σB² + 2w(1-w)ρσAσB) | Two-asset portfolios |
| Minimum-variance weight | w* = (σB² - ρσAσB) / (σA² + σB² - 2ρσAσB) | Two-asset portfolios |
| Efficient frontier | Highest expected return for each level of risk | Efficient frontier |
| Sharpe ratio | (return - rf) / volatility | Efficient frontier |
| Capital market line | rf plus x times (tangency - rf); everyone holds the tangency mix | Efficient frontier |
| Beta | Cov(asset, market) / Var(market) | CAPM and beta |
| CAPM | E(R) = rf + β × (market return - rf) | CAPM and beta |
| Alpha | Expected return minus CAPM required return | CAPM and beta |
| Rebalancing | Trade back to target weights by calendar, band or cash flow | Allocation |
What to remember
A portfolio's return is the average of its parts, but its risk is lower than the average of their risks whenever the parts are not perfectly correlated. Among all mixes, only the efficient ones deserve consideration; with a risk-free asset, one risky mix is best for everyone and your risk appetite just sets how much cash you blend in. The market pays for market risk, measured by beta, and nothing for risk you could have diversified. All of this rests on estimates, so use the theory to avoid obvious mistakes and to structure your thinking, not to compute false precision.
Traps to avoid. Treating optimizer output as exact. Believing a high Sharpe ratio means safety. Confusing beta with total risk. Changing the target mix because of the news rather than because of your life. Forgetting that rebalancing is about risk, not extra profit.
A worked mini-case
Using the chapter's example (stocks 8% return and 18% volatility, bonds 3% and 6%, correlation 0.2, risk-free rate 2%), the best risky mix is half stocks and half bonds: expected return 5.5%, volatility about 10.0% and a Sharpe ratio of about 0.35. A cautious investor who wants only about half that risk does not need a different mix of stocks and bonds. They hold half of their money in this mix and half in cash, which gives an expected 3.75% at about 5.0% volatility. An aggressive investor could hold more of the same mix, perhaps by borrowing, which raises both return and risk. Then the allocation lesson takes over: write the target down, choose a rebalancing rule and check it once a year. Remember that every number here is an invented example, and the real inputs are uncertain.
Try it
A toolbox for the whole chapter in one place. Change any input and check that the results behave as the lessons say they should.
Press Run (or Ctrl + Enter) to see the result here.
Program input · what you'd type while the program runs
Type the answers before you press Run, one per line. Each time the program reads a line (with input()), it gets the next line from this box.
Second, a chart of the capital market line and a few example portfolios, to see which ones fall below it.
Press Run (or Ctrl + Enter) to see the result here.
Program input · what you'd type while the program runs
Type the answers before you press Run, one per line. Each time the program reads a line (with input()), it gets the next line from this box.
Check your understanding
Quick check · 10 questions
of 10 answered You scored / 10 · perfect!
-
1. Stocks return 8% and bonds 3%. What is the expected return of a 40/60 stock/bond mix?
0.4 × 8 + 0.6 × 3 = 3.2 + 1.8 = 5.0%. -
2. When does a two-asset portfolio's volatility equal the weighted average of the volatilities?
Only with perfect positive correlation is there no diversification benefit. -
3. Which part of a two-asset curve is efficient?
The lower branch is dominated by portfolios with more return at the same risk. -
4. A portfolio returns 7% with 12% volatility; rf is 2%. What is the Sharpe ratio (to two decimals)?
(7 - 2) / 12 = 0.4167, about 0.42. -
5. The separation theorem says that, with a risk-free asset:
The tangency portfolio is common; risk preference sets the blend with cash. -
6. A stock with beta 1.2, rf = 2% and market return 7%. What is the CAPM required return?
2% + 1.2 × (7% - 2%) = 2% + 6% = 8.0%. -
7. An analyst expects 10% from a stock whose CAPM required return is 8.5%. Its alpha is:
10 - 8.5 = +1.5 percentage points. -
8. Why do mean-variance optimizers often produce unstable portfolios?
Small input changes shift the optimal weights a lot. -
9. A 60/40 portfolio of 10,000 becomes 7,500 stocks and 4,000 bonds. How much stock must be sold to return to 60/40?
The total is 11,500 and 60% of it is 6,900, so sell 7,500 - 6,900 = 600 of stocks. -
10. What is the main purpose of rebalancing?
Rebalancing controls risk and enforces discipline; return effects are small.
Summary
- Portfolio return is a weighted average; volatility is lower than the average of volatilities when correlation is below one.
- The efficient frontier plus a risk-free asset leads to one best risky mix (the tangency portfolio) and the capital market line.
- Beta measures market sensitivity; CAPM prices it; alpha is what is left.
- Choose a target allocation, then rebalance by calendar, bands or cash flows.
Track your progress
Create a free account to tick off lessons and pick up where you left off on any device.
of Investing and Markets lessons completed