


















Lesson 38 of 46 · Behavior, Costs and Strategy
Behavioral Biases in Investing
Learn prospect theory, loss aversion, overconfidence, the disposition effect, herding, anchoring and recency bias, with the key studies, debates and ways to cope.
Textbook finance imagines an investor who weighs facts calmly and acts to maximize wealth. Real investors read alarming headlines, hate to admit mistakes, and follow the crowd. Starting in the 1970s, psychologists and economists documented systematic patterns in how people judge risk and make financial choices, and a field called behavioral finance grew from that work. This lesson tours the best-known patterns, what the evidence actually shows, where researchers disagree, and what practical defenses exist.
What you will learn
- The main idea of prospect theory and what loss aversion predicts.
- The best-documented biases: overconfidence, the disposition effect, herding, anchoring and recency.
- What landmark studies found, and where the evidence is mixed.
- Practical rules that reduce the damage biases can do.
Key terms
Prospect theory: a descriptive theory of choice under risk in which outcomes are judged as gains and losses from a reference point.
Loss aversion: the tendency for losses to weigh more heavily than equal gains.
Overconfidence: believing your knowledge or ability is better than it is.
Disposition effect: selling winning investments too soon and holding losers too long.
Anchoring: letting an irrelevant number, such as the price you paid, shape later judgments.
Prospect theory and loss aversion
In 1979 Daniel Kahneman and Amos Tversky published "Prospect Theory: An Analysis of Decision under Risk". They showed that people's choices cannot be explained by maximizing expected wealth. Offered a sure 500 or a 50 percent chance of 1,000, most people take the sure thing. Offered a sure loss of 500 or a 50 percent chance of losing 1,000, most people gamble. The same expected values, opposite choices.
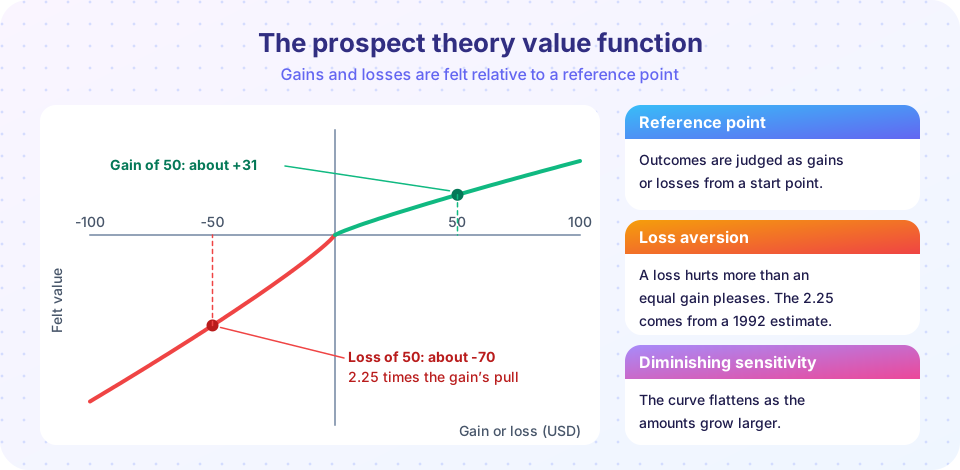
The theory's value function (see the picture) has three features. First, outcomes are judged relative to a reference point, usually the current wealth or the purchase price, not as final totals. Second, the curve is concave for gains and convex for losses: diminishing sensitivity means the difference between 0 and 100 matters more than between 1,000 and 1,100. Third, the curve is steeper for losses: loss aversion. In their 1992 follow-up, Tversky and Kahneman estimated a loss-aversion coefficient of about 2.25 and a curvature of about 0.88. A common formula is v(x) = x^0.88 for gains and v(x) = -2.25 x (-x)^0.88 for losses.
A practical consequence: a 50-50 bet to win 120 or lose 100 has a positive expected value of +10, but with a coefficient of 2.25 many people refuse it, since a loss of 100 hurts as much as a gain of about 250 pleases. The first example below computes this. Researchers still debate the exact size of loss aversion; some argue it is smaller or depends on context and the size of stakes. The general pattern, however, has been replicated in many studies.
Overconfidence and overtrading
People tend to rate themselves above average on skills, including investing. Brad Barber and Terrance Odean studied the accounts of tens of thousands of households at a discount brokerage in the 1990s. Households that traded most often earned markedly lower net returns than those that traded rarely, mainly because trading costs consumed the small gains from their picks. In a related study they found that men traded more than women and earned lower net returns, which they linked to overconfidence. The pattern fits a simple lesson: more activity is not more skill, and each trade carries costs that a buy-and-hold investor avoids. The second example simulates the cost drag of frequent trading with no skill at all.
The disposition effect
Hersh Shefrin and Meir Statman (1985) named the disposition effect: investors realize gains more readily than losses. Odean (1998) showed it in brokerage records, where gains were sold at a higher rate than losses. It is an apparent mistake: in many tax systems, selling a loser can reduce tax, and the winners that people sold did not on average underperform the losers they kept by enough to justify the pattern. Explanations include prospect theory (a sure gain is attractive, a loss triggers risk-seeking to break even), regret (selling makes the loss real) and mental accounting (treating each stock as a separate scorecard). The effect is weaker among experienced investors.
The cure is a question: "If I did not own this already, would I buy it today at this price?" The price you paid is history; only future prospects count.
Herding, momentum and bubbles
People often copy others, especially when uncertain. Herding can make sense (others may know something), but when many investors do it at once, prices can move far from fundamentals. The late 1990s technology boom is the standard example: the Nasdaq Composite rose enormously from 1995 to its peak in March 2000, then fell by more than three quarters by late 2002. Earlier episodes include the 17th-century Dutch tulip mania, although historians now debate how large and how damaging it really was.
Economists disagree about how much to credit psychology for bubbles. Efficient-market advocates argue that bubbles are hard to identify in advance and that nobody can reliably profit from calling them; behavioralists point to the limits to arbitrage: even rational traders can be wiped out if prices stay wrong longer than they can stay solvent. Both sides agree that buying because "everyone is buying" is not an analysis.
Anchoring and recency
Anchoring means that an arbitrary reference point pulls estimates toward it. Investors anchor on the purchase price ("I will sell when it gets back to what I paid"), on a past high, or on an analyst's target. The market does not know what you paid. Recency bias gives too much weight to the latest events: after a strong year, people expect more of the same and pour money in, after a crash they expect more falls and sell. Because of these two habits, individual investors' own returns have often lagged the funds they invest in, since cash arrives after rises and leaves after falls. Researchers measure this gap in different ways, and estimates vary, but the direction is consistent.
Other patterns worth knowing
- Confirmation bias: seeking evidence that supports what you already believe.
- Mental accounting: treating money differently depending on its source or label, such as "house money" after a win.
- Home bias: holding too much in your own country's stocks.
- Narrow framing: judging each investment alone rather than the whole portfolio.
- Familiarity: preferring your employer's stock or well-known names.
What helps
Knowing the biases is a start, but people rarely correct them by willpower alone. Structure works better.
- Write an investment policy before the market stresses you, with rules for saving, allocation and rebalancing.
- Automate. Automatic contributions and rebalancing take decisions out of the heat of the moment.
- Check less often. The chance of seeing a loss falls sharply as the checking interval lengthens.
- Use a cooling-off rule. Wait a set number of days before acting on a large impulse.
- Keep a decision journal. Record why you bought and what would change your mind; read it later.
- Diversify so that no single mistake is fatal.
Common misconceptions
"Biases mean markets are irrational and easy to beat." Biases are real, but exploiting them after costs is hard; even professionals rarely do it consistently.
"Loss aversion means I should avoid all risk." It means you feel losses strongly; a plan helps you take appropriate risk without panicking at normal declines.
"The studies prove every bias is large." Effects vary by sample and method, and some findings in psychology have replicated less strongly than first reported.
Try it
First, a prospect-theory calculator. It scores a gamble using the 1992 estimates and finds the gain at which a 50-50 bet against losing 100 becomes acceptable.
Press Run (or Ctrl + Enter) to see the result here.
Program input · what you'd type while the program runs
Type the answers before you press Run, one per line. Each time the program reads a line (with input()), it gets the next line from this box.
Second, the cost of overtrading. Every trade has a cost (spread and commission), and this investor has no skill: the returns of each chosen stock equal the market's. The only difference is the number of trades.
Press Run (or Ctrl + Enter) to see the result here.
Program input · what you'd type while the program runs
Type the answers before you press Run, one per line. Each time the program reads a line (with input()), it gets the next line from this box.
Third, a plot of the value function, so you can see where losses cut deeper than gains.
Press Run (or Ctrl + Enter) to see the result here.
Program input · what you'd type while the program runs
Type the answers before you press Run, one per line. Each time the program reads a line (with input()), it gets the next line from this box.
Check your understanding
Quick check · 6 questions
of 6 answered You scored / 6 · perfect!
-
1. A person refuses a 50-50 bet to win 120 or lose 100, although its expected value is positive. Which idea best explains this?
Losses are weighted more heavily than gains, so the bet feels negative even though its expected value is +10. -
2. The disposition effect is the tendency to
Investors realize gains more readily than losses, which is the opposite of what tax logic suggests. -
3. Barber and Odean found that households that traded most often tended to
Frequent trading generated costs and added little skill, so net returns were lower. -
4. An investor says 'I will sell when the stock gets back to what I paid.' This is mainly an example of
The purchase price is irrelevant to the stock's future; it works as an anchor. -
5. Which defense against behavioral errors is the most reliable?
Structure removes decisions from emotional moments, while willpower alone is unreliable. -
6. Why is a loss-aversion coefficient of 2.25 described as an estimate rather than a constant of nature?
Estimates come from particular experiments, and the size of loss aversion varies across settings.
Summary
- Prospect theory: outcomes are judged from a reference point, with diminishing sensitivity and losses weighing about twice as much as gains.
- Overconfidence encourages overtrading, which hurts net returns; the disposition effect leads to selling winners and holding losers.
- Herding, anchoring and recency push investors to buy high and sell low; evidence varies in size and some findings are debated.
- Rules, automation and diversification work better than good intentions.
Next: Costs, fees and taxes
Track your progress
Create a free account to tick off lessons and pick up where you left off on any device.
of Investing and Markets lessons completed