


















Lesson 15 of 46 · Risk, Return and Diversification
Chapter 3 review: risk, return and diversification
Review Chapter 3 of the investing course: return and volatility, geometric versus arithmetic means, types of risk, correlation and diversification, then take a ten-question quiz.
You can now put numbers on the two things every investor weighs: what an investment might earn and how uncertain that is. This review collects the chapter's formulas on one poster, links each idea back to its lesson and then tests you with ten mixed questions. Treat the quiz as a diagnostic: for every miss, rerun the matching code and change the inputs until the result feels obvious.
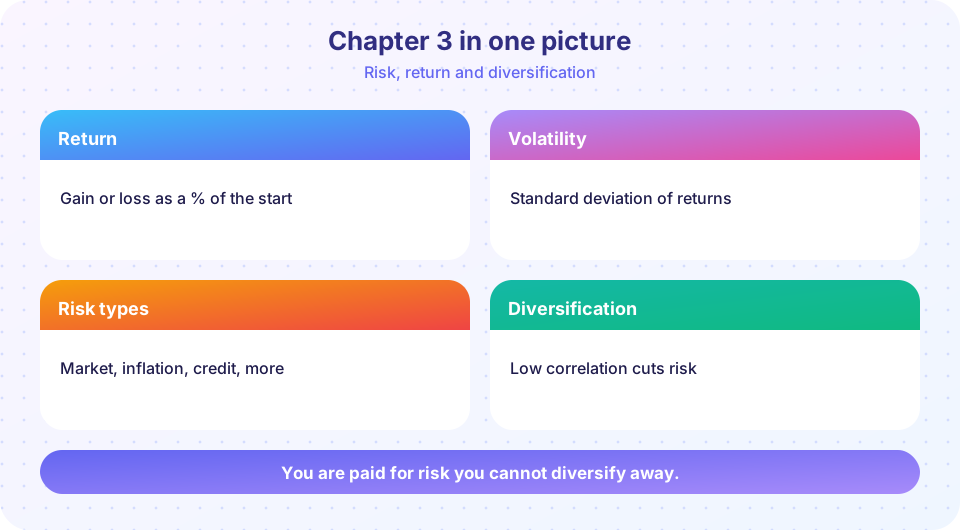
The chapter in one table
| Idea | Formula or rule | Lesson |
|---|---|---|
| Multi-period return | Multiply growth factors (1 + r1)(1 + r2)... | Returns and volatility |
| Geometric mean | (product of growth factors)^(1/n) - 1; about arithmetic - σ²/2 | Returns and volatility |
| Volatility | Standard deviation of returns; annualize monthly by √12 | Returns and volatility |
| 68-95-99.7 rule | Share of normal outcomes within 1, 2 and 3σ; real tails are fatter | Returns and volatility |
| Drawdown | Peak-to-trough fall; recovering from -x% needs x/(1-x) | Returns and volatility |
| Systematic vs idiosyncratic | Only systematic risk earns a premium | Types of risk |
| Sequence risk | Early losses plus withdrawals hurt most | Types of risk |
| Correlation | -1 to +1; lower means more diversification | Diversification |
| Two-asset volatility | √(w²σA² + (1-w)²σB² + 2w(1-w)ρσAσB) | Diversification |
| Many stocks | σp² = σ²(ρ + (1-ρ)/n); floor √ρ × σ | Diversification |
What to remember
Return is what you get, risk is how much it can vary, and the two are linked because the market pays you to bear uncertainty. But it pays only for the part you cannot avoid. You remove the avoidable part by spreading your money across assets that do not move in lockstep, and the less correlated they are, the more you remove. What remains, market risk, is the cost of earning the market's return.
Traps to avoid. Averaging returns by adding instead of compounding. Treating volatility as a maximum loss. Assuming correlations stay fixed in a crisis. Believing that 40 funds with overlapping holdings are diversified.
A worked mini-case
Take two assets, each with 20% volatility and the same expected return, held 50/50. If their correlation is +1, the portfolio has 20% volatility and you gained nothing. At correlation +0.5 it falls to 17.3%, at 0 to 14.1%, and at -0.5 to 10%. The return stayed the same in every case. Now add a second question: how deep could a fall be? A volatility of 14% suggests that a bad year of around -20% to -25% is plausible, and a -25% fall needs a +33% gain to recover. Putting the three ideas together (the volatility formula, the correlation effect and the drawdown arithmetic) is exactly what a sensible risk review does, before any money is invested.
Try it
A toolbox of the chapter's calculations: edit the data and check each result against the formulas.
Press Run (or Ctrl + Enter) to see the result here.
Program input · what you'd type while the program runs
Type the answers before you press Run, one per line. Each time the program reads a line (with input()), it gets the next line from this box.
Second, a short simulation of what diversification does to the spread of outcomes. Both portfolios have the same expected return; the invented market and company shocks are independent.
Press Run (or Ctrl + Enter) to see the result here.
Program input · what you'd type while the program runs
Type the answers before you press Run, one per line. Each time the program reads a line (with input()), it gets the next line from this box.
Check your understanding
Quick check · 10 questions
of 10 answered You scored / 10 · perfect!
-
1. Returns of +20% then -20%. What is the total result?
1.20 × 0.80 = 0.96, a 4% loss. -
2. Which statement about the geometric and arithmetic means is right?
Volatility drag makes the compound rate lower than the simple average. -
3. Annual volatility of 18% implies roughly what monthly volatility (divide by √12)?
18 / 3.46 is about 5.2%. -
4. Which risk is rewarded with a higher expected return?
Idiosyncratic risk can be removed by diversifying, so it earns no extra premium. -
5. Two assets with correlation 0 are mixed 50/50. Compared with the plain average of their volatilities, the mix is:
Correlation below +1 means the mix is less volatile than the average. -
6. A portfolio falls 50%. What gain is required to return to its peak?
0.50 × 2.00 = 1.00, so it must double. -
7. In a market crash, what usually happens to correlations between risky assets?
Selling pressure is broad, so many assets fall together. -
8. With 30% volatility per stock and ρ = 0.25, the volatility floor for a large diversified stock portfolio is:
Floor = √ρ × σ = 0.5 × 30% = 15%. -
9. Which investor is most exposed to sequence-of-returns risk?
Withdrawals during early losses leave less capital to recover. -
10. Which is true of volatility?
Losses beyond several standard deviations do occur.
Summary
- Compound returns multiply; the geometric mean is the one that matches your outcome.
- Volatility measures spread; drawdown measures the depth of the fall.
- Systematic risks stay; idiosyncratic risks can be diversified away and are unrewarded.
- Lower correlation means better diversification, but crises raise correlations.
Track your progress
Create a free account to tick off lessons and pick up where you left off on any device.
of Investing and Markets lessons completed