


















Lesson 19 of 46 · Portfolio Theory
CAPM and beta: what is a fair return for risk?
Understand beta as sensitivity to the market, the CAPM formula, the security market line, alpha, how to estimate beta from returns, and the model's known limitations.
If investors hold diversified portfolios and are paid only for market risk, then the only thing that should matter about a stock is how it moves with the market. The capital asset pricing model, CAPM, turns this idea into a formula for the expected return of any asset. Developed in the 1960s by William Sharpe, John Lintner and Jan Mossin, it is simple enough to use on a napkin. It is also the source of the word "beta", which you will hear on every finance news channel.
What you will learn
- What beta measures and how to estimate it from data.
- The CAPM formula and the security market line.
- What alpha is and how to read it.
- Why CAPM is useful, and where it falls short.
Key terms
Beta (β): the sensitivity of an asset's return to the market's return.
Market risk premium: the expected return of the market minus the risk-free rate.
Required (expected) return: the return that fair compensation for the asset's market risk would give, according to CAPM.
Alpha (α): the average return above (or below) what CAPM says an asset should earn.
Security market line (SML): the line showing required return as a function of beta.
Beta: how much does it move with the market?
Beta answers a simple question: when the overall market moves 1%, how much does this asset tend to move?
- β = 1: moves with the market on average.
- β > 1: amplifies the market. A stock with β = 1.5 tends to rise 1.5% when the market rises 1% and fall 1.5% when it falls 1%. Cyclical businesses such as airlines and carmakers often have betas above 1.
- β < 1: dampens the market. Utilities and consumer staples often have betas of 0.5 to 0.8.
- β = 0: no link to the market, like a risk-free asset.
- β < 0: moves against the market, which is rare. Some insurance-like assets can have negative betas.
Formally, beta is the covariance of the asset's returns with the market's, divided by the variance of the market:
β = Cov(asset, market) / Var(market) = ρ × σ_asset / σ_market
The second form is intuitive: beta is the correlation times the ratio of volatilities. A volatile stock that is only loosely tied to the market can have a modest beta. A portfolio's beta is just the weighted average of its holdings' betas, which is why beta, unlike volatility, adds up so neatly.
In practice you estimate beta by plotting the asset's returns against the market's over time (say, 60 monthly returns) and fitting a straight line. The slope of that line is beta. The scatter around the line is the stock's company-specific risk. You can try this in the exercise below. Beta estimates are noisy and change as companies change, so treat any single number as approximate.
The CAPM formula
CAPM states that the expected return of an asset should be:
E(R) = rf + β × (E(R_market) - rf)
In words: the risk-free rate, plus beta times the market risk premium. The idea is that you receive the risk-free rate for waiting and then extra for bearing market risk, in proportion to the amount of market risk (beta) you carry.
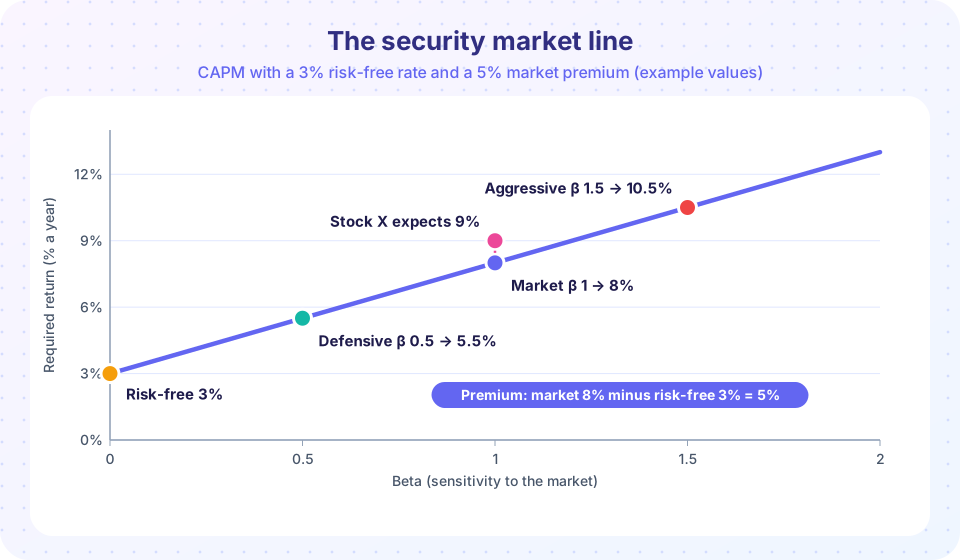
Take the example in the picture. The risk-free rate is 3% and the expected market return is 8%, so the market premium is 5%.
| Beta | Required return |
|---|---|
| 0 | 3% + 0 × 5% = 3.0% |
| 0.5 | 3% + 0.5 × 5% = 5.5% |
| 1.0 | 3% + 1.0 × 5% = 8.0% |
| 1.5 | 3% + 1.5 × 5% = 10.5% |
Plotted, these points make a straight line: the security market line. Any asset that is fairly priced lies on it. A defensive stock earns less than the market because it adds little market risk; an aggressive stock must offer more to attract buyers.
Alpha: above or below the line
Suppose an analyst expects Stock X to return 9% a year with a beta of 1. CAPM says it should return 8%. So Stock X sits one percentage point above the line: its alpha is +1%. If the analyst is right, the stock is undervalued: buying it gives more return than its market risk deserves. If a fund manager consistently produces positive alpha after costs, they are adding value beyond market exposure. If a stock sits below the line, its alpha is negative: it is overpriced for its risk.
Alpha is the thing active managers chase and the thing most struggle to deliver after fees. The CAPM framework makes the claim measurable: take away the return that came from market exposure (beta times the premium) and see what is left.
Why CAPM matters in practice
Even critics use CAPM everywhere.
- Cost of equity: companies use it to estimate the return their shareholders require, which is an input for valuing projects and companies (Chapter 5 uses it for discounting).
- Performance evaluation: funds are judged by their alpha against a benchmark.
- Portfolio construction: you can steer a portfolio's market sensitivity by choosing high- or low-beta holdings.
Where CAPM falls short
Empirical research found that the simple model does not describe returns perfectly.
- Beta alone does not explain returns. Eugene Fama and Kenneth French showed in the early 1990s that stocks of small companies and of "value" companies (cheap relative to book value) earned higher returns than their betas predicted. Their three-factor model adds size and value factors, and later models add profitability, investment and momentum. Many practitioners now think in terms of several factors, though debate continues about whether these are compensation for risk or mispricing.
- The security market line is too flat. Over many periods low-beta stocks have done better, and high-beta stocks worse, than CAPM predicts. This is called the low-beta anomaly.
- The market portfolio is not observable. The theory uses all assets, including property and human capital. Everyone uses a stock index as a proxy, which makes tests ambiguous.
- Assumptions are strong. Investors would have identical expectations, borrow and lend at the risk-free rate, and care only about mean and variance.
- Inputs are uncertain. The market premium is hard to estimate; plausible values range from about 3% to 7%, a large spread in the answer.
A fair summary: CAPM is a useful first approximation and a way of thinking, not a precise law.
Common misconceptions
"Beta measures total risk." It measures only market sensitivity. A stock can have a low beta and still be very volatile because of company-specific risk.
"A high-beta stock is a good investment." High beta means high market risk; CAPM says it should earn more on average, but it will also fall more in downturns.
"Alpha is easy to find." After costs, most investors find none, and past alpha rarely persists.
Try it
First, estimate beta from simulated data. The "market" and "stock" returns are generated with a known beta of 1.3, so you can see how close the regression gets. It lands near the true value but not exactly on it, and a different seed gives a different estimate: that is the noise in every real beta estimate. All data are invented.
Press Run (or Ctrl + Enter) to see the result here.
Program input · what you'd type while the program runs
Type the answers before you press Run, one per line. Each time the program reads a line (with input()), it gets the next line from this box.
Second, a CAPM calculator that computes required returns and alpha, and the beta of a portfolio.
Press Run (or Ctrl + Enter) to see the result here.
Program input · what you'd type while the program runs
Type the answers before you press Run, one per line. Each time the program reads a line (with input()), it gets the next line from this box.
Check your understanding
Quick check · 5 questions
of 5 answered You scored / 5 · perfect!
-
1. A stock has beta 1.4. The market rises 5%. What move would you expect, on average?
1.4 × 5% = 7%, on average; individual outcomes scatter around that. -
2. Risk-free rate 2%, market return 7%, beta 0.8. What is the CAPM required return?
2% + 0.8 × (7% - 2%) = 2% + 4% = 6%. -
3. A stock expects 10% but CAPM says it should return 8.5%. What is its alpha?
Alpha is expected return minus required return: 10 - 8.5 = +1.5%. -
4. Which describes beta correctly?
Beta measures how much the asset tends to move with the market. -
5. What did Fama and French add to CAPM in their three-factor model?
Small-company and value stocks earned more than their betas predicted.
Summary
- Beta = Cov(asset, market) / Var(market); it is the slope of asset returns against market returns.
- CAPM: E(R) = rf + β × (market premium); the security market line plots it.
- Alpha is the gap between expected and required return.
- CAPM is a useful starting point but incomplete; factor models add size, value and more.
Track your progress
Create a free account to tick off lessons and pick up where you left off on any device.
of Investing and Markets lessons completed