


















Lesson 37 of 46 · Behavior, Costs and Strategy
Chapter 8 Overview: Behavior, Costs and Strategy
See why investor behavior, fees, taxes and a written plan often matter as much as stock picking, and how the chapter's lessons build a sensible strategy.
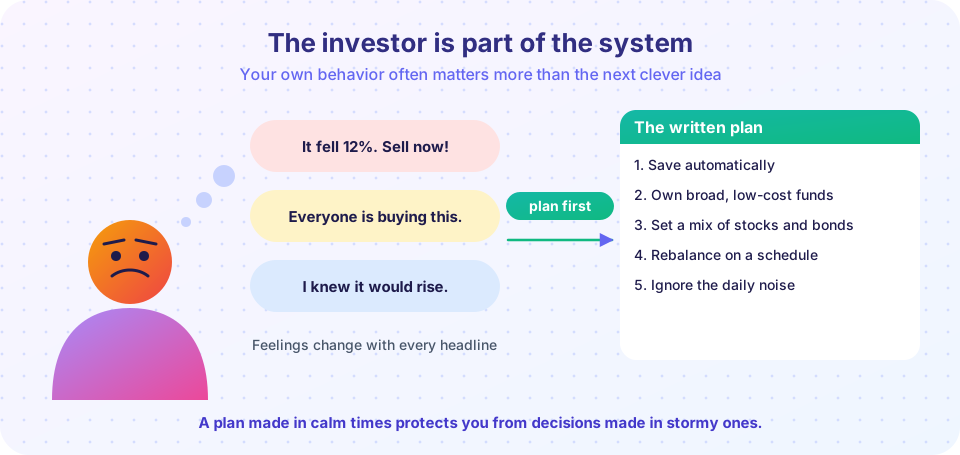
You have now seen how stocks, bonds and derivatives are valued. A reasonable question follows: if the math is this clear, why do so many investors earn less than the markets they invest in? Part of the answer is the investor, not the investment. People sell in panics, chase hot funds, trade too often, pay more in costs than they need to, and abandon plans when they are most useful. This chapter covers those human and practical factors, because for most people they decide results more than any valuation model does.
Educational information only. This chapter describes research and common practices; it is not personal financial advice. Your own situation, tax rules and risk tolerance differ, and a licensed professional can help with decisions about your money.
What you will learn
- Why behavior, costs and strategy often matter more than forecasts.
- The three themes of the chapter and how each lesson addresses one.
- What you can and cannot control as an investor.
- How a simple simulation shows the cost of reacting to short-term moves.
Key terms
Behavioral finance: the study of how psychology affects financial decisions and markets.
Cost drag: the reduction in long-term wealth caused by fees, spreads and taxes.
Asset allocation: the split of a portfolio between stocks, bonds and other assets.
Investment policy statement: a written plan of goals, risk limits and rules for making decisions.
Passive investing: holding a broad market portfolio at low cost, with little trading.
Three themes
Behavior. Human minds have rules of thumb that work in daily life and fail in markets. Loss aversion makes a 10 percent fall hurt more than a 10 percent rise pleases. Overconfidence makes people trade too much. Herding makes people buy what everyone is buying near the top. The first lesson names the main biases, tells the stories of the landmark studies, and ends with what research says helps.
Costs. Returns before costs are shared by everyone who holds the same assets, so what differs between investors is what they keep. A fund charging 1 percent a year takes a surprisingly large share of the growth over decades, as the fee-drag chart in the second lesson will show, and taxes and trading spreads add to it. Costs are one of the few things you control with certainty.
Strategy. A strategy turns principles into rules: how much to save, how to divide money among assets, how to buy, when to rebalance, and what to do when the market drops 30 percent. The third lesson compares passive and active approaches, dollar-cost averaging with investing a lump sum, and the logic of rebalancing.
What you can control
You cannot control what markets return. You can control how much you save, how widely you diversify, what costs you pay, how often you trade, and whether you stick to a plan. It is sobering that in a long horizon, these controllable factors are often as large as the differences between investments.
Three things that shape results
Controllable inputs
Returns themselves are not on this list.
What each lesson covers
- Behavioral biases: prospect theory, loss aversion, overconfidence, the disposition effect, herding and anchoring, with the key studies and the debates around them.
- Costs, fees and taxes: expense ratios, trading costs, turnover, taxes and inflation, and how small differences compound.
- Strategy and rebalancing: passive and active investing, asset allocation, dollar-cost averaging versus lump sums, and rebalancing rules.
- Chapter review: a summary picture and a ten-question quiz.
A first experiment
The code compares two investors who hold the same simulated stock fund over 20 years. One stays invested. The other sells after any 10 percent drop from a peak and buys back after the fund has recovered 5 percent from its low. The returns are random and invented, so the numbers show a mechanism rather than a prediction.
Press Run (or Ctrl + Enter) to see the result here.
Program input · what you'd type while the program runs
Type the answers before you press Run, one per line. Each time the program reads a line (with input()), it gets the next line from this box.
The second experiment shows why checking a portfolio often feels worse. It computes the chance of seeing a loss over different evaluation periods for a stylized stock-like investment with an average return of 8 percent and volatility of 16 percent a year (invented, illustrative figures).
Press Run (or Ctrl + Enter) to see the result here.
Program input · what you'd type while the program runs
Type the answers before you press Run, one per line. Each time the program reads a line (with input()), it gets the next line from this box.
Common misconceptions
"Only beginners make behavioral mistakes." Studies find the same patterns among professionals, although experience reduces some of them.
"Smart people can think their way out of biases." Knowing about a bias helps a little; rules and automation help more.
"Costs are small, so they can be ignored." A fraction of a percent a year compounds into a large fraction of wealth over decades.
Check your understanding
Quick check · 4 questions
of 4 answered You scored / 4 · perfect!
-
1. Which of these can an investor control directly?
Costs, savings rate, diversification and behavior are in the investor's hands; returns are not. -
2. What does loss aversion describe?
People generally feel the pain of a loss more strongly than the pleasure of an equivalent gain. -
3. Why does checking a portfolio daily make losses more visible than checking yearly?
Over short periods noise dominates the trend, so the portfolio is down far more often than over long periods. -
4. What is an investment policy statement?
Writing rules in calm times makes it easier to follow them in a crisis.
Summary
- Behavior, costs and strategy often explain more of an investor's results than choosing the "best" investment.
- Biases such as loss aversion, overconfidence and herding push people to buy high, sell low and trade too much.
- Costs compound against you; they are among the few things you control for sure.
- A written strategy turns principles into rules you can follow when emotions run high.
Next: Behavioral biases
Track your progress
Create a free account to tick off lessons and pick up where you left off on any device.
of Investing and Markets lessons completed