


















Lesson 42 of 46 · Projects and Practice
Project: Build a Portfolio Backtester
Build a small portfolio backtester in Python: simulate returns, apply weights, fees and rebalancing, and measure growth, volatility and maximum drawdown.
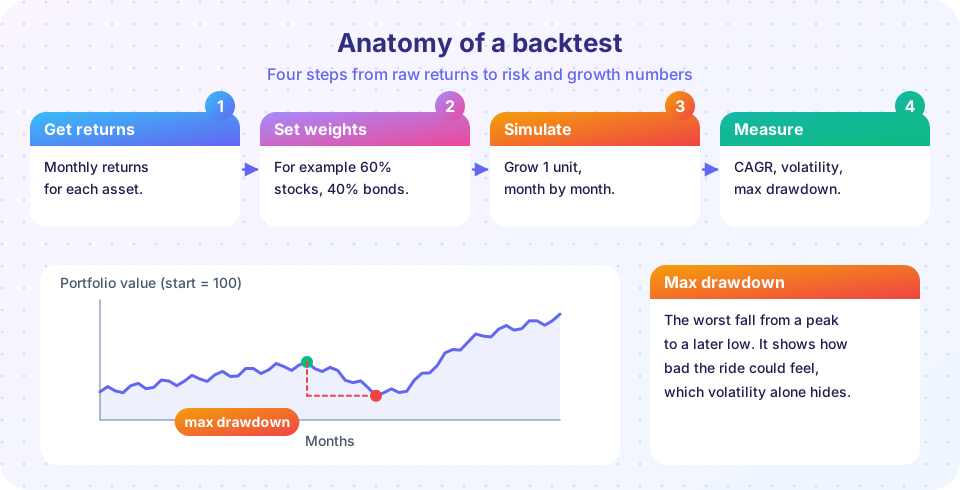
A backtest replays a strategy on data to see how it would have behaved. It is the standard way to explore ideas such as "60/40 versus 100 percent stocks" or "rebalance yearly versus never". It is also easy to misuse, so building one yourself is the best way to understand both its power and its limits. In this project you write a compact backtester in Python, run it on simulated returns, and compute the numbers professionals use to describe a portfolio: compound growth, volatility and maximum drawdown.
Educational project. The returns below are random numbers drawn from invented distributions, not real market history, so the results illustrate how the tool works. Nothing here is a forecast or a recommendation.
What you will learn
- How to structure a backtest as data, rules, simulation and measurement.
- How to implement rebalancing, fees and trading costs.
- How to compute CAGR, volatility, maximum drawdown and a simple return-per-risk ratio.
- Why backtests mislead and how to guard against the common errors.
Key terms
CAGR: compound annual growth rate, the constant yearly rate that gives the same final value.
Volatility: the annualized standard deviation of returns.
Drawdown: the percentage fall from the previous peak value; the maximum drawdown is the largest one.
Overfitting: tuning a strategy so closely to past data that it fails on new data.
Look-ahead bias: accidentally using information that was not available at the time.
Step 1: the data
A real backtest would load historical returns from a provider. To keep the project self-contained, the code generates 30 years of monthly returns for two assets: a stock-like asset (mean 8 percent a year, volatility 16 percent) and a bond-like asset (mean 4 percent, volatility 6 percent) with a correlation of 0.2. These are simply plausible orders of magnitude. The random generator uses a fixed seed so that every run gives the same numbers.
Step 2: the rules
A strategy here is defined by three things: the target weights, how often to rebalance (every n months, or never), and the costs: an annual fee taken monthly and a trading cost proportional to the amount traded at each rebalance.
The simulation keeps the dollars in each asset. Each month the holdings grow with their returns and the fee is deducted. At a rebalancing date the code computes the total, sets each asset to its target share, and charges the trading cost on the dollars that moved. This mirrors what a real portfolio does and keeps the cash flows honest.
Step 3: the measures
- CAGR =
(end / start)^(12 / months) - 1. - Volatility = standard deviation of monthly returns times the square root of 12.
- Maximum drawdown = the minimum over time of
value / running_peak - 1. - Return per unit of risk =
(CAGR - risk-free rate) / volatility, a rough version of the Sharpe ratio. The simple CAGR-based form here is a teaching simplification; the textbook Sharpe ratio uses average excess returns.
What the results do and do not show
Run the strategies in the examples below on a few different seeds. You will see the main stylized facts: a stock-heavy portfolio grows fastest on average and has the deepest drawdowns; a bond-heavy one is smoother and slower; a 60/40 mix sits in between; and fees and costs lower every curve by a similar rate, but compound into large dollar gaps. You will also see how much the answer depends on the random seed. If a ranking flips from one seed to the next, the difference between those strategies is within the noise of a single path. That is the first lesson of backtesting: a single historical path is one sample from a process with wide variation, not a law.
Reading the output like a practitioner
When you run the comparison, look at the metrics together rather than ranking on one. The stock-heavy portfolio shows the highest compound growth, but its maximum drawdown is the deepest, which tells you how much you would have had to endure to earn that growth. A drawdown of 40 percent means a portfolio of 100 falls to 60, and then has to rise 67 percent just to get back to 100; recovery arithmetic is harsher than the fall. This asymmetry is why many investors care more about drawdown than volatility, because it measures the pain of the worst stretch and can predict whether a person will stay invested through it.
Compare also the drag of costs. The 60/40 portfolio with 1.2 percent in total fees and trading costs has a lower return, but a very similar volatility and drawdown. Costs do not change the risk you take; they simply reduce what you earn for taking it. That is why the same strategy can appear in the table twice, at a low and a high cost, with the cheaper version dominating.
Finally, notice what the 200-seed experiment says about luck. Even though the stock-heavy portfolio has the highest expected return in this made-up world, it does not win every time, and the more cautious mixes win in a meaningful share of random worlds. If you could observe only one history, you would not know which kind of world you lived in. This is why practitioners ask how a strategy performed across many conditions, not only in one run.
Pitfalls to guard against
- Overfitting. If you test 100 rule variants and report the best, the winner is partly luck. Hold out data the strategy never saw, and prefer simple rules with a reason.
- Look-ahead bias. Using a number that was published later than the decision date, such as using full-year earnings in a January decision, makes a strategy look better than it could have been.
- Survivorship bias. If your dataset contains only companies that still exist, you have removed the failures, which flatters stock-picking strategies.
- Ignoring costs. Spreads, fees, taxes and slippage reduce real results; build them in, as the project does.
- Too little data. A few years may contain one market regime. Look at multiple periods and, if possible, multiple markets.
- Assuming the past repeats. A backtest describes what happened under conditions that may not return.
Extensions
- Add a third asset (for example, a "cash" asset with a small return) and test three-way weights.
- Implement threshold rebalancing (trade only when a weight drifts more than 5 points).
- Add a monthly contribution and compare the final value with a lump sum.
- Use a block bootstrap (resampling consecutive months) instead of independent draws, to keep realistic clustering of bad months.
- Add inflation and report real results.
Common misconceptions
"A good backtest proves a strategy works." It shows the strategy would have worked on that data; whether it works going forward is a separate question.
"Lower volatility always means better." Return per unit of risk matters, but so do your goals; a very safe portfolio may not reach them.
"Maximum drawdown is the worst that can happen." It is the worst in the sample you tested; a longer or different sample may contain a deeper one.
Try it
First, the core engine: generate returns, simulate a strategy, and compute measures.
Press Run (or Ctrl + Enter) to see the result here.
Program input · what you'd type while the program runs
Type the answers before you press Run, one per line. Each time the program reads a line (with input()), it gets the next line from this box.
Second, a comparison of five strategies on the same returns, then on 200 different random seeds to show how often each ranks first on final value.
Press Run (or Ctrl + Enter) to see the result here.
Program input · what you'd type while the program runs
Type the answers before you press Run, one per line. Each time the program reads a line (with input()), it gets the next line from this box.
Third, plot the growth of the strategies and the drawdowns underneath.
Press Run (or Ctrl + Enter) to see the result here.
Program input · what you'd type while the program runs
Type the answers before you press Run, one per line. Each time the program reads a line (with input()), it gets the next line from this box.
Check your understanding
Quick check · 5 questions
of 5 answered You scored / 5 · perfect!
-
1. A portfolio grows from 100 to 400 in 20 years. What is its CAGR?
400 / 100 = 4, and 4^(1/20) - 1 is about 7.18%. -
2. A portfolio rises to 150, falls to 105, then rises to 160. What is its maximum drawdown?
The largest fall from a peak is from 150 to 105, which is -30%. -
3. Testing 200 variants of a strategy and reporting only the best one is an example of
The best result of many trials is partly luck and is unlikely to repeat. -
4. Why does a backtest of a stock-picking strategy that uses only today's index members look better than it should?
Companies that failed or were dropped from the index are missing, which flatters results. -
5. If the ranking of two strategies changes with the random seed, what does that suggest?
A single path is one noisy sample, so small differences can be reversed by chance.
Summary
- A backtester has four parts: data, rules, simulation and measures.
- CAGR, volatility and maximum drawdown describe growth, variability and the worst fall.
- Fees, trading costs and rebalancing rules change results and should be modeled.
- Overfitting, look-ahead and survivorship bias are the classic ways a backtest misleads.
Next: Practice problems
Track your progress
Create a free account to tick off lessons and pick up where you left off on any device.
of Investing and Markets lessons completed