


















Lesson 29 of 45 · Transition Metals
Redox Chemistry: Latimer and Frost Diagrams
Use standard potentials, Latimer diagrams and Frost diagrams to compare oxidation states, predict disproportionation and apply the Nernst equation.
Which oxidation state of manganese will survive in acidic water? Will Fe³⁺ oxidize iodide? Why does copper(I) fall apart in solution? These are questions about redox thermodynamics, and inorganic chemists answer them with two compact diagrams: the Latimer diagram, which lists potentials between neighboring oxidation states, and the Frost diagram, which turns the same data into a picture where stability can be read at a glance. You will use both on manganese, iron and copper.
What you will learn
- Read a Latimer diagram and calculate a non-adjacent potential.
- Draw and interpret a Frost diagram (nE° versus oxidation number).
- Predict disproportionation and comproportionation.
- Use the Nernst equation, including the effect of pH.
- Connect E° to ΔG° and K.
Key terms
Standard reduction potential E°: the potential of a half-reaction at standard conditions relative to the hydrogen electrode.
Latimer diagram: a chain of species from most oxidized to most reduced with E° (in volts) written over each arrow.
Frost diagram: a plot of nE° (volt-equivalents) against oxidation number n for a series of species of one element.
Disproportionation: a species is simultaneously oxidized and reduced.
Comproportionation: two species of the same element in different oxidation states react to give one in an intermediate state.
Latimer diagrams
Here is the Latimer diagram for manganese in acidic solution (volts, versus the standard hydrogen electrode):
MnO₄⁻ —0.56→ MnO₄²⁻ —2.26→ MnO₂ —0.95→ Mn³⁺ —1.51→ Mn²⁺ —(−1.18)→ Mn
Each arrow is a reduction, so the number above it is the E° of the couple on its left. To get the potential between non-adjacent species, add the nE° values of the steps and divide by the total number of electrons, because free energy (ΔG° = −nFE°) is the quantity that adds, not voltage:
E°(MnO₄⁻/Mn²⁺) = (1×0.56 + 2×2.26 + 1×0.95 + 1×1.51) / 5 = 1.51 V
That agrees with the tabulated value for permanganate reduced to Mn²⁺ in acid, a good check on both the data and the method.
Disproportionation from a Latimer diagram
Take a species in the middle of the diagram. If the potential to its right is larger than the potential to its left, it disproportionates. For Mn³⁺: left 0.95 V, right 1.51 V, so 1.51 > 0.95 and 2 Mn³⁺ + 2 H₂O → MnO₂ + Mn²⁺ + 4 H⁺ goes forward. Manganate MnO₄²⁻ has 0.56 on its left and 2.26 on its right, so it also disproportionates in acid, which is why green manganate solutions must be kept basic.
Copper gives the textbook case: Cu²⁺ —0.153→ Cu⁺ —0.521→ Cu. Since 0.521 > 0.153, 2 Cu⁺ → Cu²⁺ + Cu: copper(I) is unstable in water unless a ligand or a solid (CuI, Cu₂O) stabilizes it. Iron is the opposite: Fe³⁺ —0.771→ Fe²⁺ —(−0.447)→ Fe. Since the right value is lower than the left, Fe²⁺ is stable toward disproportionation.
Frost diagrams
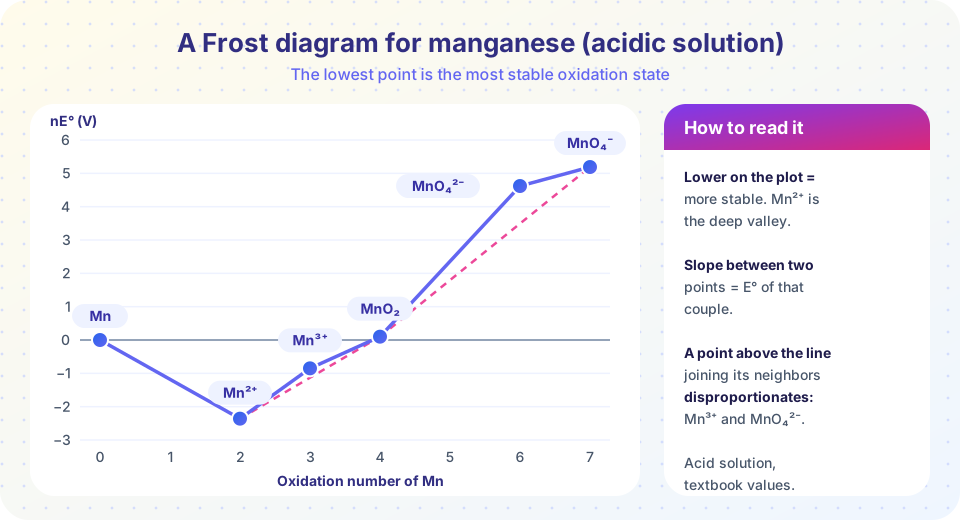
A Frost diagram plots nE° (the free-energy equivalent, in volts per electron count) against oxidation number n, taking the element's zero state as the origin. To build one, you take the Latimer potentials and accumulate: from Mn (0) to Mn²⁺ is 2 × (−1.18) = −2.36; adding 1 × 1.51 gives Mn³⁺ at −0.85; adding 1 × 0.95 gives MnO₂ at 0.10, and so on.
Reading the diagram:
- The lower the point, the more stable the species (in that medium). Mn²⁺ is the deep valley, so it is the thermodynamic sink in acid.
- The slope of a line joining two points is the E° of that couple. Steeper upward lines mean strong oxidizers.
- A point above the straight line between its two neighbors disproportionates. Mn³⁺ and MnO₄²⁻ sit above such lines.
- A point below the line is stable toward disproportionation; two neighbors would comproportionate to it.
Compare iron's data: Fe at 0, Fe²⁺ at −0.894 V (−0.447 × 2) and Fe³⁺ at −0.123 V (−0.894 + 0.771). Fe²⁺ is the lowest point: the stable species in acid in the absence of air.
The Nernst equation and pH
For a half-reaction Ox + n e⁻ → Red, the real potential at 25 °C is
E = E° − (0.0592 / n) × log₁₀ Q
Reactions that consume H⁺ depend on pH. For permanganate, MnO₄⁻ + 8 H⁺ + 5 e⁻ → Mn²⁺ + 4 H₂O, with all other concentrations at 1 M:
E = 1.51 − (0.0592 × 8 / 5) × pH = 1.51 − 0.0947 × pH
At pH 0 it is a monster oxidizer; at pH 7 it falls to about 0.85 V. That is why Frost diagrams come in acid and base versions, and why the product of permanganate reduction is Mn²⁺ in acid but MnO₂ in neutral or basic solution.
Finally, link E° to equilibrium: ΔG° = −nFE° and log₁₀ K = nE° / 0.0592 at 25 °C. For the titration reaction MnO₄⁻ + 5 Fe²⁺ + 8 H⁺ → Mn²⁺ + 5 Fe³⁺ + 4 H₂O, E°cell = 1.51 − 0.77 = 0.74 V and n = 5, so log K ≈ 62: the reaction is effectively complete, and permanganate itself acts as the indicator when a pink tinge persists.
Common misconceptions
"Voltages add when you combine half-reactions." nE° adds (as free energy), not E°. Always weight by electrons.
"A large positive E° means a fast reaction." E° gives the driving force, not the rate.
"Disproportionation needs a catalyst." Thermodynamically it just needs the potential condition; kinetics may still slow it.
Try it
Plot the pH dependence of the permanganate couple and the pH-independent Fe³⁺/Fe²⁺ couple, and find where they cross. The calculation uses the Nernst equation with 1 M concentrations for the other species.
Press Run (or Ctrl + Enter) to see the result here.
Program input · what you'd type while the program runs
Type the answers before you press Run, one per line. Each time the program reads a line (with input()), it gets the next line from this box.
Next, a Latimer-diagram calculator: it computes the potential between any two species and flags disproportionation. The data are standard acidic-solution potentials, typed in by hand.
Press Run (or Ctrl + Enter) to see the console output here.
No output.
Check your understanding
Quick check · 5 questions
of 5 answered You scored / 5 · perfect!
-
1. In a Latimer diagram A —0.80→ B —1.20→ C, what happens to B?
The potential on the right (1.20) is greater than on the left (0.80), so B disproportionates. -
2. How do you combine two adjacent potentials?
Free energy adds, so nE° values add; divide by the total number of electrons. -
3. In a Frost diagram, the most stable oxidation state is...
The lowest nE° corresponds to the lowest free energy. -
4. What is E for MnO₄⁻/Mn²⁺ at pH 2 (all else 1 M)?
E = 1.51 − 0.0947 × 2 ≈ 1.32 V. -
5. Why is Cu⁺ unstable in water?
0.521 V on the right exceeds 0.153 V on the left.
Summary
- A Latimer diagram lists E° between neighboring oxidation states; non-adjacent potentials come from adding nE° and dividing by the total n.
- A Frost diagram plots nE° against oxidation number; low points are stable, and points above the line joining their neighbors disproportionate.
- The Nernst equation shows that H⁺-consuming couples lose oxidizing power as pH rises.
- E° connects to ΔG° and K: log K = nE°/0.0592 at 25 °C.
Next: Chapter Review
Track your progress
Create a free account to tick off lessons and pick up where you left off on any device.
of Inorganic Chemistry lessons completed