


















Lesson 30 of 45 · Sensory Science
Sensory Testing Methods
Learn how food companies test with people: discrimination tests such as the triangle test, trained descriptive panels, consumer liking, bias control and the statistics behind p-values.
A product developer reformulates a granola bar with less sugar. Does it taste different? Do customers like it as much? Opinions in a meeting prove nothing. Sensory scientists answer these questions with designed experiments that give a number, a confidence and a decision. This lesson introduces the three families of tests, then works through the most common one, the triangle test, in detail, because it shows in a few lines how statistics separates a real difference from a lucky guess.
What you will learn
- Distinguish discrimination, descriptive and affective (consumer) tests and say when to use each.
- Run and analyze a triangle test using the binomial distribution.
- Explain p-values, significance level, errors and the effect of panel size.
- List the common biases in sensory tests and how designs control them.
Key terms
Discrimination test: asks whether two products can be told apart (triangle, duo-trio, paired comparison).
Descriptive analysis: a trained panel rates the intensity of defined attributes (sweetness, crispness, cooked flavor).
Affective test: asks consumers how much they like or prefer a product.
p-value: the probability of a result at least this extreme if there were no real difference.
Power: the probability that a test finds a difference when one really exists.
Three families of tests
| Family | Question | Panel | Typical size | Examples |
|---|---|---|---|---|
| Discrimination | Are the products different? | Screened or trained | 24 to 60 | Triangle, duo-trio, 2-AFC, 3-AFC, A-not-A |
| Descriptive | How do they differ, and by how much? | Trained | 8 to 12 | Quantitative descriptive analysis, spectrum method, check-all-that-apply |
| Affective | Do people like them? | Consumers | 50 to several hundred | 9-point hedonic scale, preference paired test, just-about-right scales |
Use discrimination to check a change you hoped would be invisible: a cheaper supplier, a new process, a sugar reduction. Use descriptive analysis to build a map of the product's sensory profile and to link it to chemistry and process variables. Use affective tests to predict sales and to optimize a recipe. A good project uses all three: confirm that a prototype differs (or not), find out how, and then check whether consumers prefer it.
The triangle test
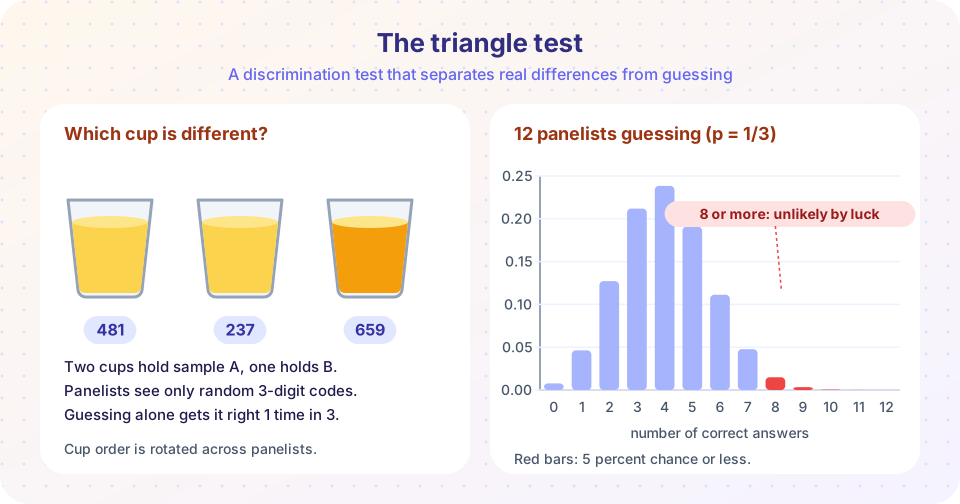
In a triangle test each panelist receives three coded samples in a random order: two are the same product and one is different. The task is to pick the odd one. Because three positions are possible, a person who cannot tell the difference still has a one-in-three chance (p = 1/3) of being right.
The null hypothesis, H₀, says "no perceptible difference," so the number of correct answers X follows a binomial distribution with probability 1/3. The question becomes: how likely is a score at least this high if everyone is just guessing? That tail probability is the p-value:
p = P(X ≥ k) = sum for i = k..n of C(n, i) × (1/3)^i × (2/3)^(n−i)
Convention sets a significance level α, usually 0.05. If p is at most α you reject H₀ and conclude that a difference is perceptible. For a given panel size there is a minimum number of correct answers that does this.
Worked example. With 30 panelists, 15 pick the odd sample. Under pure guessing, the probability of 15 or more correct is about 0.0435, which is below 0.05, so you conclude the samples differ. With 14 correct the probability is above 0.05 and you would not. The table below gives the minimum number of correct answers at α = 0.05 for a triangle test, matching the standard published tables.
| Panelists n | 12 | 18 | 24 | 30 | 36 | 48 | 60 |
|---|---|---|---|---|---|---|---|
| Minimum correct | 8 | 10 | 13 | 15 | 18 | 22 | 27 |
The required fraction falls as the panel grows (67 percent of 12 but 45 percent of 60), which is what makes large panels able to detect smaller differences.
Two kinds of mistake
A Type I error is a false alarm: concluding there is a difference when there is none. The significance level α is its chance, usually 5 percent. A Type II error is a miss: concluding there is no difference when there is one. Its probability is called β, and power = 1 − β. For the triangle test with 30 panelists and a critical count of 15, if 50 percent of the panel truly pick the odd sample correctly (a clear but not huge effect), the chance of reaching 15 is only about 57 percent in this simple model. That is why a "no significant difference" result from a small panel must never be read as proof that the products are the same. When your goal is to show similarity, as in a supplier change, you design a similarity test with a larger panel and a stated tolerance.
Other discrimination tests
- Duo-trio: a reference and two coded samples; pick the one that matches the reference. Chance is 1/2.
- Paired comparison (2-AFC): two samples and a question such as "which is sweeter?" Chance is 1/2. It is more sensitive than a triangle test when you know which attribute changed, because the task is easier.
- 3-AFC: three samples, one different in a specified attribute. Chance is 1/3.
- A-not-A: the panelist first learns what A is, then says whether each sample is A or not-A. It is useful when samples cannot be presented together.
Descriptive analysis
In a descriptive panel, selected people train for weeks. They agree on a vocabulary, calibrate against reference foods ("this much saltiness is a 5"), and then rate coded samples on line scales, in booths, with replicates. Results are analyzed with analysis of variance and displayed as spider plots or principal-component maps. Descriptive panels are expensive but give a rich profile; a variation called check-all-that-apply (CATA) lets untrained consumers tick the attributes they perceive, which is quicker and cheaper.
Consumer (affective) tests
The most common is the 9-point hedonic scale, from "dislike extremely" (1) through "neither like nor dislike" (5) to "like extremely" (9). The mean liking scores are compared with a t-test or ANOVA. Preference tests ask which of two products a consumer prefers (a binomial test with p = 1/2, two-sided, because either product might win). Just-about-right (JAR) scales ask whether an attribute, such as sweetness, is too little, just right or too much, which tells the developer which way to move. Consumer panels also provide demographics, so you can see which segment likes which version.
Keeping the test honest: sources of bias
People are not machines. Good design controls these known effects:
- Order and position effects: the first sample is often rated differently. Balance the order across panelists.
- Carry-over and fatigue: strong flavors linger, and taste buds tire. Provide rinse water, unsalted crackers and breaks, and limit the number of samples per session.
- Expectation and halo: a brand name or a label shapes ratings. Code the samples and use neutral containers.
- Contrast and convergence: a mediocre sample looks worse after a great one. Randomize order.
- Suggestion between panelists: keep booths separate; no talking.
Safety and ethics also matter: panelists give informed consent, are asked about allergies, and are never given a sample that has not been approved as safe to eat.
Common misconceptions
"No significant difference means the products are identical." It only means this test could not detect a difference. A small panel has little power.
"A p-value of 0.04 means a 96 percent chance the products differ." The p-value is the probability of the data if there were no difference, not the probability that the hypothesis is true.
"Experts are better than consumers for everything." Trained panelists describe differences precisely, but only consumers can tell you what they like.
Try it
First, how the required score changes with the size of a triangle-test panel. The code uses the exact binomial distribution.
Press Run (or Ctrl + Enter) to see the result here.
Program input · what you'd type while the program runs
Type the answers before you press Run, one per line. Each time the program reads a line (with input()), it gets the next line from this box.
Second, a simulator. Each simulated panelist either truly detects the difference (with the probability you choose) or guesses with a 1 in 3 chance. Press the button to run the test once, and run 500 repeats to estimate the test's power. It is a simplified model of panel behavior, for learning only.
Third, a preference test calculator: out of n consumers, k prefer product A. The two-sided exact binomial test with p = 1/2 tells you whether the split is more lopsided than chance.
Press Run (or Ctrl + Enter) to see the console output here.
No output.
Check your understanding
Quick check · 5 questions
of 5 answered You scored / 5 · perfect!
-
1. In a triangle test with no real difference, what is the chance that a panelist picks the odd sample by guessing?
There are three samples and one is odd, so a random guess is right one time in three. -
2. A triangle test with 24 panelists needs 13 correct to be significant at α = 0.05. You get 12. Which conclusion is justified?
Failing to reach significance is a lack of evidence, not proof of equality. -
3. Which test family answers the question 'How much do consumers like it?'
Affective tests, such as the 9-point hedonic scale, measure liking and preference. -
4. Why are samples presented in a balanced or random order?
Position in the sequence changes ratings, so designs balance or randomize the order. -
5. What is power in a sensory test?
Power = 1 − β, the chance the test finds a difference that truly exists.
Summary
- Three test families answer three questions: discrimination (different?), descriptive (how?) and affective (liked?).
- A triangle test has a chance level of 1/3; the p-value is a binomial tail probability, and 30 panelists need 15 correct at α = 0.05.
- Significance controls false alarms (Type I); power depends on panel size and the true effect.
- Failing to find a difference is not proof of similarity; design a similarity test when that is the goal.
- Control order, carry-over, expectation and contrast effects with coding, rinsing and balanced designs.
- Consumer tests use hedonic, preference and just-about-right scales to guide product development.
Next: Chapter 6 review
Track your progress
Create a free account to tick off lessons and pick up where you left off on any device.
of Food Science lessons completed