


















Lesson 41 of 45 · Projects and Practice
Project: Predict Shelf Life with Q10
A guided food science project: design an accelerated shelf-life test, fit an Arrhenius model, estimate Q10 and predict shelf life at storage temperature, with limits and a report outline.
How long will a granola bar stay good? A manufacturer cannot wait two years to find out before printing a date on the pack, so food scientists use accelerated shelf-life testing: store samples warmer than normal, where spoilage runs faster, record when they fail, and calculate back to normal storage. In this project you will do the whole job on a worked example: choose a failure criterion, plan the test, analyze the data with the Arrhenius equation, express the result as a Q10 value and predict shelf life at 20 °C. It draws together the kinetics from the thermal processing lesson and the vitamin-loss lesson, the statistics of the sensory chapter, and the packaging and regulatory ideas of the innovation chapter.
What you will learn
- Define the end of shelf life using sensory, chemical or microbiological criteria.
- Plan an accelerated test: temperatures, sampling times and number of replicates.
- Fit an Arrhenius model to rate data, and compute Q10 and activation energy.
- Predict shelf life at the real storage temperature, and state the limits of the prediction.
Key terms
Shelf life: the time during which a food keeps its safety and quality under stated storage conditions.
Failure criterion: the measurable point at which a food counts as no longer acceptable, for example a sensory score or a peroxide value.
Q10: the factor by which the rate of a reaction increases for a 10 °C rise in temperature.
Activation energy (Ea): the energy barrier of a reaction in J/mol; a higher Ea means rates are more temperature-sensitive.
Accelerated shelf-life test (ASLT): storing a product at elevated temperature to shorten the time needed to see spoilage.
Step 1: define what "failure" means
A food does not suddenly become bad. First decide what limits its life:
- Microbiological: for a perishable chilled food, the time for spoilage bacteria to reach a limit. Safety is a separate question: a food must be safe for its entire date, so shelf life is never extended by testing if a pathogen can grow.
- Chemical: lipid oxidation (rancidity) measured by peroxide value or hexanal; vitamin loss; browning; loss of pigment.
- Physical: staling, loss of crispness (moisture uptake), caking, oil separation, creaming of emulsions.
- Sensory: the point where a trained panel or consumers detect an unacceptable change. Many shelf lives are ultimately defined this way; a common approach is the time when a stated share of consumers (for example half) would reject the product.
For our worked example, the granola bar fails when a panel detects rancid flavor, which we link to a rise in peroxide value above a limit agreed in advance.
Step 2: plan the test
A good plan balances speed and validity.
- Temperatures. Choose at least three that are above normal storage but low enough that the same reaction dominates: for a dry bar, 30, 40 and 50 °C. Add a cold control (for example 4 °C or −18 °C) to anchor the reference sample.
- Sampling schedule. More samples near the expected failure time, based on a pilot. For the 50 °C group that may be weekly; for 30 °C every two or three weeks.
- Replicates. At least three packs per time and temperature, from different production lots if possible.
- Measurements. One sensory and one or two instrumental indicators, such as peroxide value, moisture content and water activity, texture.
- Packaging. Test in the final pack, since oxygen and moisture barriers decide much of the result.
- Humidity. Humidity and temperature interact. For moisture-sensitive products, control relative humidity as well as temperature.
Step 3: from rates to Arrhenius
Suppose the quality indicator reaches the failure limit at a time t_f. If the reaction path is the same at every temperature, the rate is proportional to 1 / t_f. The Arrhenius equation relates the rate constant to temperature:
k(T) = A × e^(−Ea / (R × T)) so ln k = ln A − (Ea / R) × (1 / T)
with T in kelvin and R = 8.314 J/(mol·K). Plot ln k against 1/T: you should get a straight line with slope −Ea/R. From it you can compute the Q10 value between two temperatures:
Q10 = k(T + 10) / k(T) = exp[ Ea × 10 / (R × T × (T + 10)) ]
An Ea of 50 kJ/mol gives a Q10 of about 2.0 near room temperature, and 80 kJ/mol about 3.0. Many food deterioration reactions have Q10 values between 2 and 3; enzyme-catalyzed and microbial processes fall in a similar range, while some physical changes have values near 1.
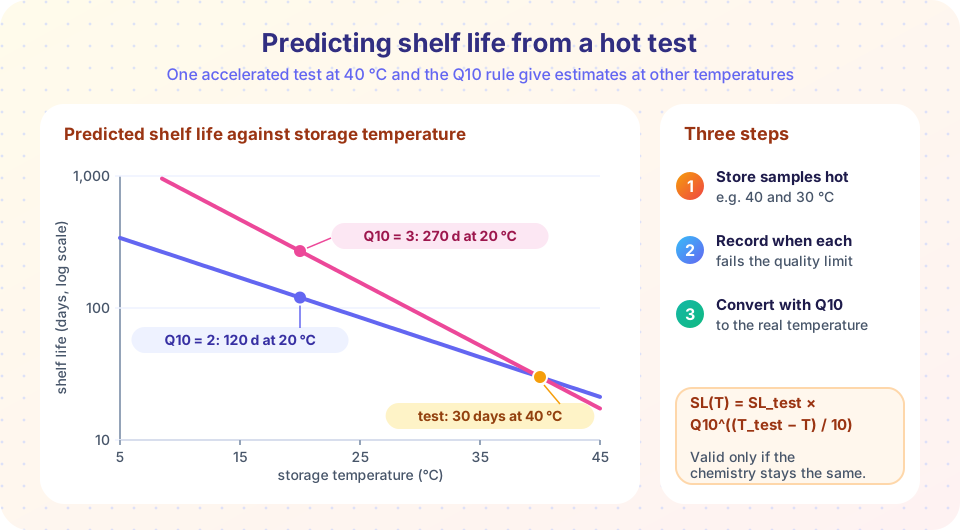
With a Q10 you can convert a shelf life measured at T_test to another temperature:
SL(T) = SL(T_test) × Q10^((T_test − T) / 10)
Worked example. A product fails after 30 days at 40 °C. If Q10 is 2, at 20 °C the shelf life is 30 × 2² = 120 days; if Q10 is 3 it is 30 × 3² = 270 days. The difference between 120 and 270 days shows why Q10 must be measured and not guessed.
Step 4: analyze, predict, and check
In the first example under Try it, the days to failure are example data (invented for this exercise, as if from a granola bar test at 30, 40 and 50 °C). The program fits the Arrhenius line, computes Ea and Q10, and predicts shelf life at 20 and 25 °C. Run it: with these numbers the fit gives an Ea of about 61 kJ/mol, a Q10 of about 2.2 and roughly 270 days (9 months) at 20 °C. Then change the numbers and watch the prediction move.
Step 5: know the limits
An accelerated prediction is only as good as its assumptions.
- Same mechanism at every temperature. If heat also melts the fat, hardens a glassy sugar matrix, denatures protein or dries the product, the failure at 50 °C may not be the failure at 20 °C. Extrapolating far beyond the tested range is risky.
- Nonlinear Arrhenius plots near phase changes (melting, the glass transition) mean Q10 itself changes with temperature.
- Real life is not constant. Products spend time in warm trucks and cold stores; the "mean kinetic temperature" summarizes a fluctuating history, and the Arrhenius model can be integrated over it, as you did for F0.
- Safety first. A shelf life from quality tests must never be longer than a microbiologically safe period.
- Verify in real time. Keep real-time storage samples at the true temperature, and check the prediction against them as they age.
Common misconceptions
"Q10 is always 2." Q10 depends on the reaction. Enzymatic and chemical changes range from about 1.5 to 4 or more, so a single rule of thumb is a starting point.
"A prediction replaces real-time testing." It speeds up planning, but regulators and careful companies confirm with real-time samples.
"Shelf life is a safety guarantee." A best-before date is about quality; use-by dates relate to safety. Both require controlled storage.
Try it
First, the full analysis. It fits an Arrhenius line to made-up failure times, reports Ea and Q10, and plots the prediction.
Press Run (or Ctrl + Enter) to see the result here.
Program input · what you'd type while the program runs
Type the answers before you press Run, one per line. Each time the program reads a line (with input()), it gets the next line from this box.
Second, a Q10 predictor. Set the test temperature, the shelf life you measured, a Q10 and the temperature you want to know about.
Third, Q10 from two measurements, and the activation energy it implies.
Press Run (or Ctrl + Enter) to see the console output here.
No output.
Project report outline
Write up your own project (for the granola bar or any food you choose) in this order, one paragraph per heading:
- Product and goal: what the product is and what shelf life you want to support.
- Failure criterion: how failure was defined and why.
- Design: temperatures, times, replicates, measurements, packaging.
- Results: a table of time to failure, the Arrhenius plot, Ea and Q10.
- Prediction: shelf life at the target temperature, with a safety margin.
- Limits and next steps: assumptions, real-time confirmation, labeling date and storage statement.
Check your understanding
Quick check · 5 questions
of 5 answered You scored / 5 · perfect!
-
1. A product fails after 45 days at 40 °C. With Q10 = 2, what is the predicted shelf life at 30 °C?
A 10 °C drop doubles the shelf life: 45 × 2 = 90 days. -
2. On an Arrhenius plot, what is plotted against 1/T?
ln k versus 1/T is a straight line with slope −Ea/R. -
3. Which situation makes an accelerated test unreliable?
A phase change introduces a new mechanism, so extrapolation breaks down. -
4. A higher activation energy means:
Higher Ea gives a larger Q10, so rates grow faster with temperature. -
5. Why keep real-time samples during an accelerated study?
Real-time storage verifies that the accelerated prediction holds at the actual temperature.
Summary
- Shelf life ends at a defined failure criterion: microbiological, chemical, physical or sensory; safety limits override quality.
- An accelerated test stores samples at several elevated temperatures and records time to failure.
- Fitting
ln k = ln A − (Ea / R)(1/T)gives Ea; Q10 follows, andSL(T) = SL_test × Q10^((T_test − T)/10). - Q10 is typically 2 to 3 for food deterioration but must be measured; Ea of 50 kJ/mol gives about 2.0 and 80 kJ/mol about 3.
- Limits: same mechanism, no phase changes, constant conditions, and real-time confirmation.
Next: Practice problems
Track your progress
Create a free account to tick off lessons and pick up where you left off on any device.
of Food Science lessons completed