


















Lesson 39 of 45 · Working Capital and Valuation
Chapter review: Working Capital and Valuation
Review the cash conversion cycle, discounted cash flow valuation, multiples and sensitivity analysis with a recap table, a calculator that links them and a ten-question quiz.
This chapter connected two clocks. In the short run, a firm survives by turning inventory and receivables into cash faster than it must pay its own bills. In the long run, it is worth the present value of the free cash it generates. The review below puts the formulas side by side and shows how a change in working capital flows straight into valuation.
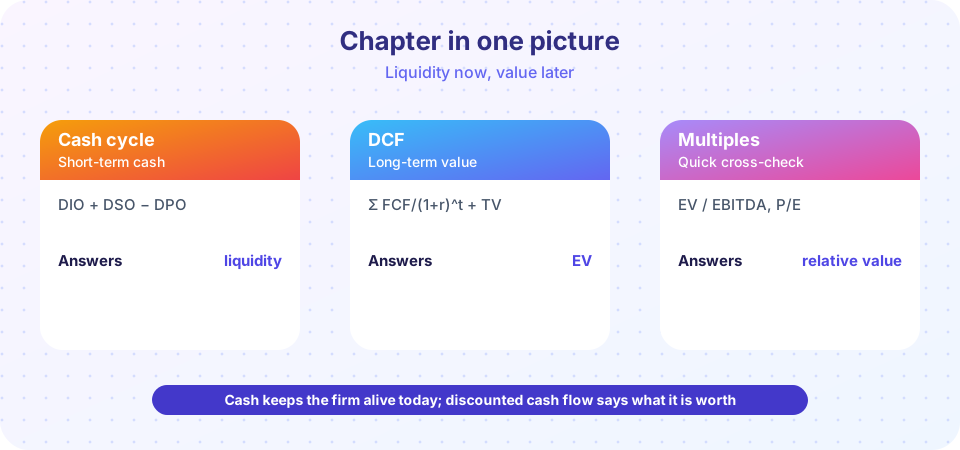
The link between the two halves
Free cash flow subtracts the increase in net working capital. A firm that grows sales 10% with a long cash conversion cycle must pour more cash into inventory and receivables than one with a short cycle, so its free cash flow, and therefore its DCF value, is lower. Cutting ten days from the cycle (the cash conversion cycle) releases a one-off sum and lowers future reinvestment, which shows up as more value in the DCF (DCF valuation). Multiples and sensitivity tables (multiples and sensitivity) then test whether that answer is plausible and how fragile it is.
Recap table
| Idea | Formula | Remember |
|---|---|---|
| DIO | Inventory / COGS × 365 | cost-based |
| DSO | Receivables / Sales × 365 | sales-based |
| DPO | Payables / COGS × 365 | cost-based |
| Cash conversion cycle | DIO + DSO − DPO | days of self-funding |
| Cost of skipping a discount | (1 + d/(1 − d))^(365/(N − t)) − 1 | 2/10 net 30 costs about 45% |
| EOQ | √(2DS/H) | ordering equals holding at optimum |
| FCFF | EBIT(1 − T) + D&A − CapEx − ΔNWC | discount at WACC |
| Terminal value | FCFF × (1 + g)/(WACC − g) | needs g below WACC |
| Equity value | EV − net debt (− other claims) | divide by diluted shares |
| Multiples | EV/EBITDA, P/E | match numerator and denominator |
| Sensitivity | grid, scenarios, simulation | report a range |
Traps that catch people
- Using the wrong base. Receivables are compared with sales; inventory and payables with cost of goods sold. Mixing them gives meaningless day counts.
- Reading a negative cycle as a crisis. Some strong businesses collect before they pay. Check why the figure is negative before reacting.
- Forgetting growth. A firm growing quickly must keep adding to inventory and receivables, so working capital absorbs cash even when the cycle length is stable.
- A terminal value from the wrong year. Discount it by the same number of years as the final forecast cash flow, not one fewer.
- Letting g reach WACC. The Gordon formula breaks as g approaches the discount rate. Keep growth well below it and below the economy's long-run growth.
- Subtracting interest from FCFF. Interest and the tax shield are already in WACC; deducting them again double counts.
- Trusting a single multiple. Peers can be priced too high or too low together. Use several methods and a sensitivity range.
Explain it in one minute
"Profit is not cash. A firm buys inventory, sells on credit and eventually collects, and the days between paying and collecting must be funded. Shorter cycles release cash. Over the long run, a business is worth the present value of the free cash it generates: forecast it, discount it at the cost of capital, add a terminal value for the years beyond, and subtract net debt to get what belongs to shareholders. Because forecasts are uncertain, cross-check with peer multiples and show how the answer changes when the inputs do." Say it, then do one numeric example.
Try it
A single calculator that links the two halves: change the receivable days and see both the cash released and the effect on a simple DCF with a working-capital line.
Press Run (or Ctrl + Enter) to see the result here.
Program input · what you'd type while the program runs
Type the answers before you press Run, one per line. Each time the program reads a line (with input()), it gets the next line from this box.
Check your understanding
Quick check · 10 questions
of 10 answered You scored / 10 · perfect!
-
1. COGS $1,460m and inventory $200m. DIO?
200 / 1,460 × 365 = 50 days. -
2. DIO 40, DSO 35, DPO 45. The cash conversion cycle is:
40 + 35 − 45 = 30 days. -
3. Daily sales are $5m. DSO falls by 4 days. Cash released:
4 days × $5m = $20m. -
4. EOQ with D = 2,000, S = $25, H = $1?
√(2 × 2,000 × 25 / 1) = √100,000 ≈ 316. -
5. FCFF components: NOPAT 60, D&A 15, capex 20, increase in NWC 5. What is FCFF?
60 + 15 − 20 − 5 = 50. -
6. FCFF₅ = 40, WACC = 8%, g = 2%. The terminal value at year 5 is about:
40 × 1.02 / 0.06 = 680. -
7. EV = $1,000m, net debt = $200m, 50m shares. Value per share?
Equity = 800; 800 / 50 = $16. -
8. Why is EV/EBITDA preferred to P/E when comparing companies with very different debt levels?
Enterprise multiples compare the whole business before financing, so leverage does not distort them. -
9. What does a wide spread in a sensitivity grid tell you?
Large swings from small input changes mean the estimate is uncertain and should be reported as a range. -
10. If g rises to equal WACC in the Gordon formula, what happens to the terminal value?
The denominator WACC − g approaches zero. Growth must stay well below the discount rate.
Summary
- The cash conversion cycle measures days of self-funding: DIO + DSO − DPO.
- FCFF discounted at WACC plus a terminal value gives enterprise value; subtract net debt for equity.
- Multiples and sensitivity tables cross-check and stress-test the DCF.
- Working capital links the chapter: more cash tied up means lower free cash flow and value.
Track your progress
Create a free account to tick off lessons and pick up where you left off on any device.
of Corporate Finance lessons completed