


















Lesson 34 of 45 · Capital Structure and Payout
Chapter review: Capital Structure and Payout
Review Modigliani-Miller, the trade-off theory, EBIT-EPS analysis, dividends and buybacks with a recap table, a small calculator and a ten-question quiz.
This chapter asked two questions: how should a firm be funded, and how should it share its cash? Both started from a world where the answer is "it does not matter", and both then climbed back toward reality by adding frictions one at a time. The review below puts the logic on a single page and checks that you can use the formulas without the lesson text beside you.
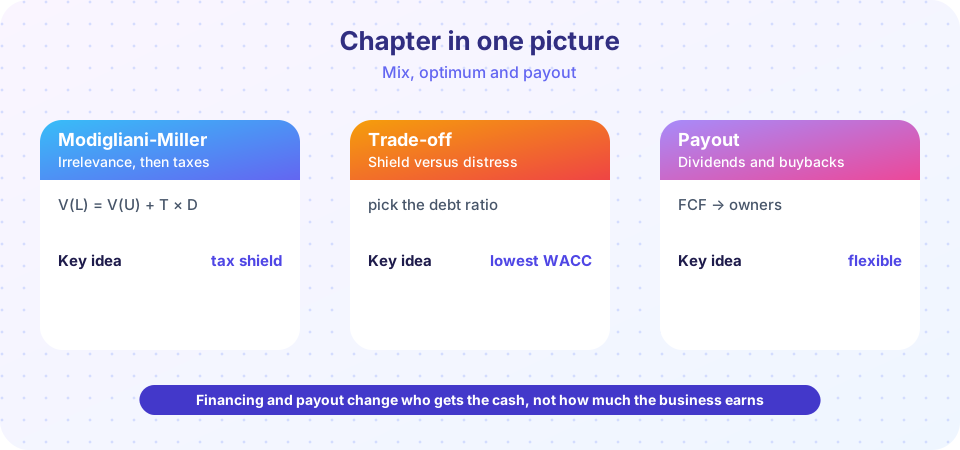
The thread that ties it together
A firm's operating decisions create cash flows. Financing decisions only decide who owns the claims on those flows and in what order. That is why, in perfect markets, neither the debt-equity mix (Modigliani-Miller) nor the payout form (payout policy) changes value. Real value shifts come from frictions: the tax shield (a transfer from the tax authority), distress and agency costs (value destroyed or lost) and information gaps (trade-off theory). When someone claims a financing choice "creates value", ask which of these frictions it exploits.
Recap table
| Topic | Key formula or fact | Remember |
|---|---|---|
| MM I (no tax) | V_L = V_U | pie size does not depend on slicing |
| MM II (no tax) | Re = R0 + (R0 − Rd) × D/E | WACC stays at R0 |
| MM I (tax, permanent debt) | V_L = V_U + T × D | the shield is worth T × D |
| MM II (tax) | Re = R0 + (R0 − Rd)(1 − T) D/E | WACC falls as debt rises |
| Trade-off | V = V_U + shield − distress | optimum is a range |
| Pecking order | retained earnings, debt, then equity | information drives it |
| EBIT-EPS break-even | EBIT/shares_A = (EBIT − I)/shares_B | EPS is not value |
| DFL | EBIT / (EBIT − interest) | amplification factor |
| Payout | dividend ≈ buyback in wealth, no taxes | signal, flexibility, tax matter |
| Residual dividend | NI − equity share × investment | lumpy, so firms smooth |
Traps that catch people
- "Debt is cheaper, so use more." Per dollar, debt is cheaper, but it makes equity riskier. Without taxes the effects cancel exactly; with taxes the tax shield is the only real gain, and distress costs push back.
- Confusing EPS with value. Borrowing to buy back shares raises EPS in good years and cuts it in bad ones. The question is whether value per share changes, and by itself it does not.
- Using T × D for any debt. The formula assumes permanent debt and a firm that can always use the deduction. Temporary or risky debt is worth less.
- Treating the optimum as a precise number. The trade-off theory tells you the direction of each force, not the exact target. Practitioners aim for a range and a credit rating.
- Believing buybacks always create value. Buying shares above their worth transfers value from the shareholders who stay to those who sell.
- Ignoring signals. A dividend cut is read as bad news even when the economics of the cut are sound. Managers know this and smooth dividends.
Explain it in one minute
"In a perfect market, how you split a firm's cash flows between lenders and owners cannot change what the firm is worth. Taxes break that: interest is deductible, so debt adds value equal to the tax rate times the debt. But more debt raises the chance and cost of distress and creates conflicts between lenders and owners, so there is a sweet spot, usually a range. Payout works the same way: a dividend or a buyback just moves cash from the firm to owners, so which one is better depends on taxes, signalling and flexibility rather than on wealth." Use this as a template for any financing question.
Try it
One function that implements both MM cases so you can see how taxes change the picture for any inputs.
Press Run (or Ctrl + Enter) to see the result here.
Program input · what you'd type while the program runs
Type the answers before you press Run, one per line. Each time the program reads a line (with input()), it gets the next line from this box.
Check your understanding
Quick check · 10 questions
of 10 answered You scored / 10 · perfect!
-
1. In a no-tax world, a firm borrows to buy back shares. Firm value:
MM Proposition I: value depends on the cash flows, not on how they are split. -
2. R0 = 12%, Rd = 6%, D/E = 1, no tax. The cost of equity is:
Re = 12% + (12% − 6%) × 1 = 18%. -
3. T = 20%, permanent debt = $500m. The tax shield is worth:
T × D = 0.20 × 500 = $100m. -
4. What offsets the tax shield in the trade-off theory?
Expected distress and agency costs rise with leverage and eventually exceed the marginal tax benefit. -
5. Break-even EBIT with Plan A (12m shares, no interest) and Plan B (8m shares, $6m interest) is:
EBIT/12 = (EBIT − 6)/8 gives 8 × EBIT = 12 × EBIT − 72, so EBIT = 18. -
6. EBIT = $30m, interest = $6m. DFL is:
30 / (30 − 6) = 1.25. -
7. A firm with 100m shares at $20 pays a $0.50 dividend. The ex-dividend price is about:
Each share loses the $0.50 paid out. -
8. Which statement about buybacks is true?
EPS rises mechanically, but the cash given up was worth the same. -
9. Net income $60m, equity weight 50%, projects $80m. Residual dividend?
Equity needed 0.5 × 80 = 40; dividend = 60 − 40 = $20m. -
10. Which is the pecking-order order of preference?
Internal funds avoid the information cost of outside financing; new equity is last.
Summary
- Without frictions, neither capital structure nor payout form changes value.
- Taxes add
T × D; distress and agency costs push back; the optimum is a range. - EBIT-EPS analysis shows leverage's effect on earnings, not on value.
- Dividends and buybacks differ in taxes, signals and flexibility, not in wealth at fair prices.
Track your progress
Create a free account to tick off lessons and pick up where you left off on any device.
of Corporate Finance lessons completed