


















Lesson 17 of 45 · Capital Budgeting
The net present value rule
Learn to compute net present value, apply the accept-if-positive rule, compare mutually exclusive projects, and test how sensitive NPV is to forecasts.
If you remember one thing from this course, make it this: accept projects with a positive net present value. NPV measures, in today's dollars, how much richer a project makes the firm's owners. A project with an NPV of +$115 adds $115 of value; a project with an NPV of -$50 takes $50 away. No other rule in capital budgeting has such a direct link to the goal of the firm from chapter 1.
This lesson defines NPV, works a complete example, shows why the rule is correct, and then looks at the practical issues: choosing between projects, projects of different sizes and lives, and how fragile an NPV can be when the forecast changes.
What you will learn
- Compute NPV from a list of cash flows and a discount rate.
- Explain why accepting positive-NPV projects maximizes firm value.
- Choose between mutually exclusive projects and use the profitability index.
- Compare projects with unequal lives using the equivalent annual cost.
- Test how sensitive an NPV is to the forecast.
Key terms
Net present value (NPV): the present value of a project's future cash flows minus its initial cost.
Discount rate: the required return for a project of this risk, also called the hurdle rate or cost of capital.
Initial outlay: the cash spent at the start (time 0), entered as a negative number.
Profitability index (PI): present value of future cash flows divided by the initial cost.
Equivalent annual cost (EAC): the level yearly cost that has the same present value as a project's costs.
The formula
NPV = CF0 + CF1 / (1 + r) + CF2 / (1 + r)^2 + ... + CFn / (1 + r)^n
CF0 is usually negative (the investment). The later flows are the cash the project brings in or costs each year. The discount rate r reflects the project's risk. In chapter 6 you will learn how to calculate it; for now it is given.
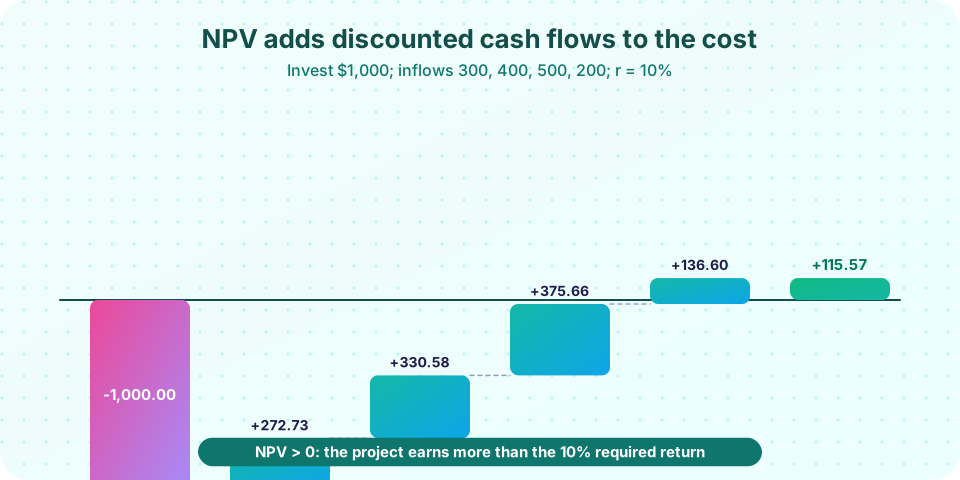
Example. A project costs $1,000 today. It is expected to bring in $300, $400, $500 and $200 at the ends of years 1 to 4. The discount rate is 10%.
| Year | Cash flow | Discount factor | Present value |
|---|---|---|---|
| 0 | -1,000 | 1.0000 | -1,000.00 |
| 1 | 300 | 0.9091 | 272.73 |
| 2 | 400 | 0.8264 | 330.58 |
| 3 | 500 | 0.7513 | 375.66 |
| 4 | 200 | 0.6830 | 136.60 |
| NPV | 115.57 |
The sum of the discounted inflows is 1,115.57, and the project costs 1,000, so it adds $115.57 of value. The picture above shows this as a waterfall. The decision: accept.
Why the rule works
Think of the discount rate as what the owners could earn elsewhere on investments of the same risk. A positive NPV means the project earns more than that alternative, so the owners are better off. An NPV of 115.57 means that if you could borrow today at the discount rate, you could spend 115.57 more today and still repay all your debts from the project's cash flows. Because NPVs are measured in today's dollars, they also add up: the value created by a company is the sum of the NPVs of its projects. This property, value additivity, is why a manager can evaluate projects one by one.
The decision rule
- NPV > 0: accept (the project earns more than its required return).
- NPV = 0: indifferent (it just earns the required return).
- NPV < 0: reject.
The NPV rule uses all cash flows, takes into account the time value of money, and accounts for risk through the discount rate. Its weakness is that it depends on forecasts and on the discount rate, but every rule does.
Choosing between mutually exclusive projects
When you can only do one, pick the highest NPV. Suppose another project, Y, costs $500 and returns 200, 250, 300 and 100 over four years. At 10%, its NPV is $182.13. Project X above has an NPV of $115.57. Y is the better choice, even though X is bigger, because it creates more value. (If the projects were independent and the firm had the money, it would take both.)
Profitability index
When money is limited (capital rationing), dollars invested become scarce and it makes sense to rank projects by value per dollar:
PI = PV of future cash flows / initial cost
X: 1,115.57 / 1,000 = 1.12. Y: 682.13 / 500 = 1.36. Y returns more value per dollar. A PI above 1 is equivalent to a positive NPV. Use the PI to rank independent projects when the budget is fixed, not to choose between mutually exclusive projects of different sizes (NPV is still the better guide there).
Projects with unequal lives
Suppose you must pick one of two machines, both needed for the foreseeable future. Machine A costs $10,000, lasts 3 years and costs $2,000 a year to maintain. Machine B costs $15,000, lasts 5 years and costs $1,500 a year. At 10%:
- PV of costs of A:
10,000 + 2,000 x 2.48685 = $14,973.70 - PV of costs of B:
15,000 + 1,500 x 3.79079 = $20,686.18
B costs more in total, but it lasts longer, so the comparison is unfair. Convert each to an equivalent annual cost: divide the PV of costs by the annuity factor for its life. A: 14,973.70 / 2.48685 = $6,021.15 a year. B: 20,686.18 / 3.79079 = $5,456.96 a year. B is cheaper per year of service and wins.
How fragile is the NPV?
NPVs rest on forecasts, so test them. In our example the project's NPV is 115.57. Cut every inflow by 10% (a 10% sales shortfall) and the NPV falls to just $4.01. Cut by 12% and it is negative. That is a thin margin: the project is only just attractive. Compare this with a project whose NPV stays positive even if inflows drop by 40%. The first needs more scrutiny.
The tests analysts use:
- Sensitivity analysis: change one input at a time (sales, cost, rate) and see how the NPV changes.
- Break-even analysis: find the value of an input at which NPV equals zero.
- Scenario analysis: compute NPV under best, expected and worst cases.
Chapter 9 returns to these in more depth.
Spreadsheet trap. The NPV function in Excel and Google Sheets assumes the first value is at the end of period 1, not time 0. To get the real NPV, add the initial cost separately: =NPV(rate, CF1:CFn) + CF0.
Common misconceptions
"A project with a positive accounting profit has a positive NPV." Profit ignores the cost of the money tied up. A project can be profitable but earn less than the discount rate, which makes its NPV negative.
"Choose the project with the largest total cash inflows." Timing and size of the investment matter; NPV counts both.
"A discount rate is just a guess." It is the return available on alternative investments of the same risk, and it should be estimated carefully (chapters 5 and 6).
Try it
The first program is an NPV toolbox: the NPV of the example, the profitability index, the comparison with project Y, equivalent annual costs, and the sensitivity to a shortfall in inflows.
Press Run (or Ctrl + Enter) to see the result here.
Program input · what you'd type while the program runs
Type the answers before you press Run, one per line. Each time the program reads a line (with input()), it gets the next line from this box.
The second program plots how the NPV of project X reacts to a shortfall in cash inflows and to a change of the discount rate, which is the kind of picture a manager looks at before approving a project.
Press Run (or Ctrl + Enter) to see the result here.
Program input · what you'd type while the program runs
Type the answers before you press Run, one per line. Each time the program reads a line (with input()), it gets the next line from this box.
Check your understanding
Quick check · 5 questions
of 5 answered You scored / 5 · perfect!
-
1. A project costs $500 and returns $600 in one year. The discount rate is 10%. The NPV is:
600 / 1.10 = 545.45, and 545.45 - 500 = 45.45. -
2. According to the NPV rule, a firm should accept an independent project when:
A positive NPV means the project earns more than the required return, so it adds value. -
3. Two mutually exclusive projects: P costs $2,000 with NPV $80; Q costs $500 with NPV $120. Which should the firm choose?
Among mutually exclusive projects choose the highest NPV, regardless of size. -
4. Why use the equivalent annual cost?
Dividing the present value of costs by the annuity factor for the asset's life gives a comparable yearly cost. -
5. The Excel function NPV(rate, CF1:CFn) treats the first value as occurring at:
Excel assumes the first value is one period away, so the initial cost at time 0 must be added separately.
Summary
NPV = sum of CFt / (1 + r)^t, with the initial cost entered as a negative cash flow at time 0.- Accept projects with NPV > 0; the NPV is the value added, in today's dollars.
- NPVs add up (value additivity); choose the highest NPV among mutually exclusive projects.
- PI ranks projects under a budget limit; EAC compares assets with unequal lives.
- Test sensitivity to forecasts, and remember that Excel's
NPVstarts at period 1.
Next: IRR and payback
Track your progress
Create a free account to tick off lessons and pick up where you left off on any device.
of Corporate Finance lessons completed