


















Lesson 41 of 46 · Projects and Practice
Project: build tight-binding band structures
A hands-on project: compute the bands of a diatomic chain and a square lattice with numpy, extract gaps and effective masses, and plot a density of states with van Hove singularities.
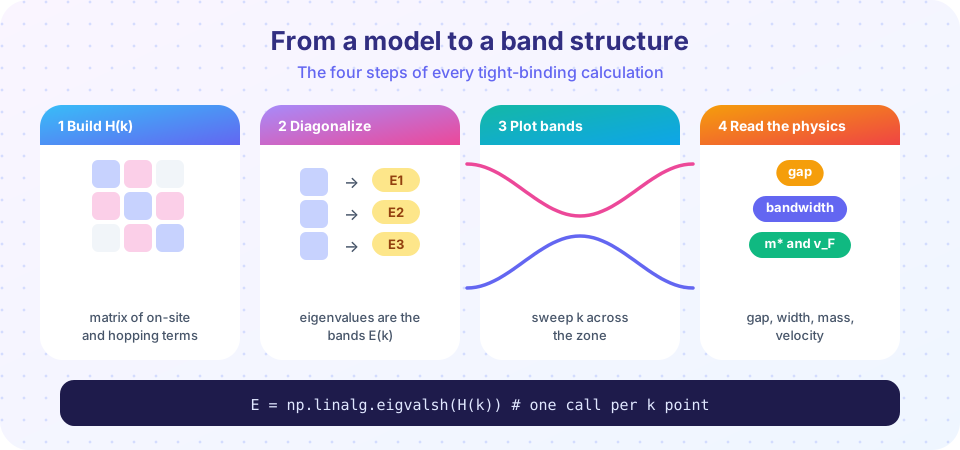
Everything in chapters 5 to 8 can be turned into a few lines of code, because a tight-binding band structure is the set of eigenvalues of a small matrix H(k). In this project you will write that matrix for three model crystals, diagonalize it along a path in the Brillouin zone, and extract the quantities that matter: gaps, effective masses and the density of states. The goal is not a perfect model of a real material but a toolkit you can reuse on any lattice.
What you will learn
- How to write and diagonalize a Bloch Hamiltonian H(k) for a lattice with a basis.
- How to extract the gap and the effective mass numerically.
- How to compute a density of states by sampling the Brillouin zone and see a van Hove singularity.
- How to check a code against known closed-form results.
Key terms
Bloch Hamiltonian H(k): the matrix of the Hamiltonian in the basis of Bloch sums of the orbitals in one unit cell.
Density of states g(E): the number of states per unit energy per unit cell (or volume).
Van Hove singularity: a feature in g(E) where the band velocity vanishes (a saddle point or extremum of E(k)).
Finite-difference mass: m* = ħ²/(d²E/dk²) estimated from three neighboring k points.
Step 1: a diatomic chain with two different atoms
Take a chain with two atoms per cell, on-site energies ε_A and ε_B, and uniform nearest-neighbor hopping t, and let the cell length be a (so the atoms are a/2 apart). The Bloch Hamiltonian is
H(k) = [[ε_A, −t(1 + e^(−ika))], [−t(1 + e^(ika)), ε_B]]
with eigenvalues E±(k) = (ε_A + ε_B)/2 ± sqrt(Δ² + 4t² cos²(ka/2)), where Δ = (ε_A − ε_B)/2. At the zone edge k = π/a the cosine vanishes, so the gap is 2|Δ| = |ε_A − ε_B|. This is the model of an ionic crystal (NaCl-like) or of the two inequivalent sublattices in boron nitride: different on-site energies open a gap, whereas equal ones (graphene) leave it closed.
Press Run (or Ctrl + Enter) to see the result here.
Program input · what you'd type while the program runs
Type the answers before you press Run, one per line. Each time the program reads a line (with input()), it gets the next line from this box.
Step 2: the square lattice and its density of states
For a square lattice with one orbital per site, E(k) = −2t(cos k_x a + cos k_y a). To get the density of states, sample a fine grid of k points over the zone and make a histogram of the energies. Because E is a sum of two cosines, the function has saddle points at (π, 0) and (0, π) where E = 0: the density of states has a logarithmic van Hove singularity at the band center. At the band edges ±4t the DOS jumps to a constant, the signature of two-dimensional parabolic bands.
Press Run (or Ctrl + Enter) to see the result here.
Program input · what you'd type while the program runs
Type the answers before you press Run, one per line. Each time the program reads a line (with input()), it gets the next line from this box.
Step 3: your turn
- Change ε_A and ε_B in the first program so that ε_A = ε_B and confirm that the gap closes and the two bands fold into a cosine of period 2π/a with half the zone.
- Add a second-neighbor hopping t′ to the square lattice, E = −2t(cos k_x + cos k_y) − 4t′ cos k_x cos k_y, and see how the van Hove peak moves away from E = 0. (Cuprate models use t′ ≈ −0.3t.)
- Make a 3-site chain (ABA) by building a 3 × 3 H(k) and check that it has three bands.
- Use the graphene code from the previous chapter and add an on-site energy ±Δ on the two sublattices. Show that the Dirac point acquires a gap 2Δ.
Common misconceptions
"If the code gives the right eigenvalues, the model is right." A tight-binding code only reproduces the model you wrote down. Whether the model matches a real material requires comparison with experiment or first-principles calculations.
"More k points always improve the answer." For smooth quantities like energy, a modest grid suffices; for a density of states near a van Hove singularity, histogram noise decreases as you add points but never converges exactly at the singularity. Use broadening or the tetrahedron method for accurate work.
Check your understanding
Quick check · 4 questions
of 4 answered You scored / 4 · perfect!
-
1. A diatomic chain with on-site energies +1 and −1 (units of t) and hopping t has a gap of
The gap is |ε_A − ε_B| = 2 in these units. -
2. In the square-lattice density of states the van Hove singularity sits at
The saddle points (π, 0) and (0, π) have E = 0 and zero velocity. -
3. What is the bandwidth of the square-lattice band E = −2t(cos k_x + cos k_y)?
The energy ranges from −4t to +4t. -
4. Why is a finite-difference estimate of the effective mass useful?
m* = ħ²/(d²E/dk²) can be evaluated on any numerically computed band.
Summary
- A tight-binding band structure is the eigenvalue problem of a small matrix H(k) built from on-site energies and hoppings.
- Different on-site energies on two sublattices open a gap |ε_A − ε_B|.
- The density of states of a square lattice has a logarithmic van Hove singularity at the band center.
- Always compare your code with a closed-form limit before using it on something new.
Track your progress
Create a free account to tick off lessons and pick up where you left off on any device.
of Condensed Matter Physics lessons completed