


















Lesson 8 of 45 · Measurement, Error and Statistics
Statistics of replicates: mean, standard deviation and confidence intervals
Summarize replicate measurements with the mean, sample standard deviation, RSD and a t-based confidence interval, and see how many replicates you need.
Suppose you titrate five portions of the same solution and read 24.82, 24.78, 24.85, 24.80 and 24.79 mL. What is "the" volume? And how much would you expect a sixth measurement to differ? Statistics turns a handful of numbers into an honest statement: a best estimate and an interval in which the true value probably lies.
What you will learn
- Calculate the mean, sample standard deviation, variance and relative standard deviation.
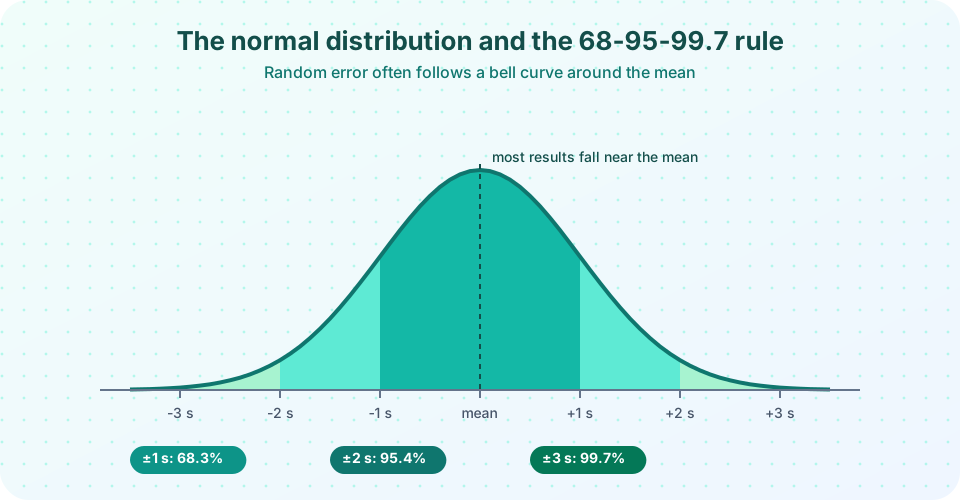
- Explain the normal distribution and the 68-95-99.7 rule.
- Build a confidence interval for the mean using Student's t.
- Estimate how many replicates are needed for a target precision.
Key terms
Mean (x̄): the sum of the results divided by their number n.
Sample standard deviation (s): the typical spread of single results about the mean.
Variance: s², the square of the standard deviation.
RSD (relative standard deviation, coefficient of variation): 100 × s / x̄, in percent.
Standard error of the mean: s / √n, the uncertainty of the mean.
The mean and the standard deviation
For n replicates x_1 … x_n:
x̄ = Σ x_i / n and s = √( Σ (x_i − x̄)² / (n − 1) )
The divisor n − 1 (the degrees of freedom) is used because the mean was estimated from the same data, which makes the deviations a little too small. For our titration: the mean is 24.808 mL, the squared deviations sum to 0.00308, so s = √(0.00308/4) ≈ 0.028 mL and RSD ≈ 0.11 %.
If the whole population of possible results is known, the symbols are μ (true mean) and σ (population standard deviation). In practice you only have a sample, so you estimate μ with x̄ and σ with s.
The normal distribution
Random error is often described by the bell curve with density f(x) = 1/(σ√(2π)) × exp(−(x − μ)²/(2σ²)). About 68.3 % of results fall within ±1σ of μ, 95.4 % within ±2σ and 99.7 % within ±3σ. That is why a result more than three standard deviations from the mean is suspicious.
The standard error and confidence intervals
Averaging n values shrinks the uncertainty of the mean to s/√n. To turn that into a statement with a stated probability, use Student's t, which accounts for the fact that s itself is only an estimate:
μ = x̄ ± t × s / √n
Typical values of t for 95 % confidence: 4.303 (ν = 2), 3.182 (3), 2.776 (4), 2.571 (5), 2.262 (9), approaching 1.960 for very large n. Here ν = n − 1.
For our titration, n = 5, so t = 2.776 and the interval is 24.808 ± 2.776 × 0.0277/√5 = 24.808 ± 0.034 mL. Read this as: "if the method were repeated many times, 95 % of such intervals would contain the true mean." It is not the statement that 95 % of individual results lie in this interval.
Because the width falls as 1/√n, quadrupling the replicates only halves the interval. That is why a handful of replicates (three to six) is the usual compromise.
How many replicates?
If you need the mean within ±E and you know s approximately, then n ≈ (t s / E)². Since t depends on n, start with t = 1.96 and iterate. With s = 0.028 mL and E = 0.02 mL: n ≈ (1.96 × 0.028/0.02)² = 7.5. But with only 8 replicates t is about 2.4, not 1.96, so you iterate: the answer settles at about 10 replicates.
Common misconceptions
"The confidence interval contains 95 % of the data." It describes the mean, not individual values.
"A small s proves the result is accurate." s measures random scatter only; a bias is invisible in it.
"Use n instead of n − 1 for a small sample." That underestimates s; use n − 1.
Try it
Press Run (or Ctrl + Enter) to see the result here.
Program input · what you'd type while the program runs
Type the answers before you press Run, one per line. Each time the program reads a line (with input()), it gets the next line from this box.
Press Run (or Ctrl + Enter) to see the console output here.
No output.
Check your understanding
Quick check · 5 questions
of 5 answered You scored / 5 · perfect!
-
1. Results: 10.1, 10.3, 9.9, 10.2, 10.0. The mean is
The sum is 50.5; divided by 5 it is 10.1. -
2. Why is the standard deviation of a sample divided by n − 1?
Deviations from the sample mean are smaller than deviations from the unknown true mean; dividing by n − 1 corrects that bias. -
3. About what fraction of normally distributed results lies within ±2σ of the mean?
±2σ contains 95.4 %. -
4. n = 4, x̄ = 50.00, s = 0.20, t(95 %, 3 d.f.) = 3.182. The 95 % confidence interval is
t s / √n = 3.182 × 0.20 / 2 = 0.318 ≈ 0.32. -
5. To halve the width of a confidence interval (same s) you need roughly
The width scales with 1/√n, so halving it needs about four times the data.
Summary
- Report the mean, s (with n − 1) and RSD for replicates.
- Random error follows the normal distribution: 68 %, 95 % and 99.7 % within 1, 2 and 3 σ.
- The mean's uncertainty is s/√n; the t-based interval
x̄ ± t s/√nhas a stated confidence. - Precision improves slowly with n: choose n from the target interval.
Next: Significance tests
Track your progress
Create a free account to tick off lessons and pick up where you left off on any device.
of Analytical Chemistry lessons completed