


















Lesson 6 of 45 · Measurement, Error and Statistics
Chapter 2 overview: measurement, error and statistics
Preview chapter 2: why every measurement is uncertain, how bias and random error differ, and how statistics lets you state and test results honestly.
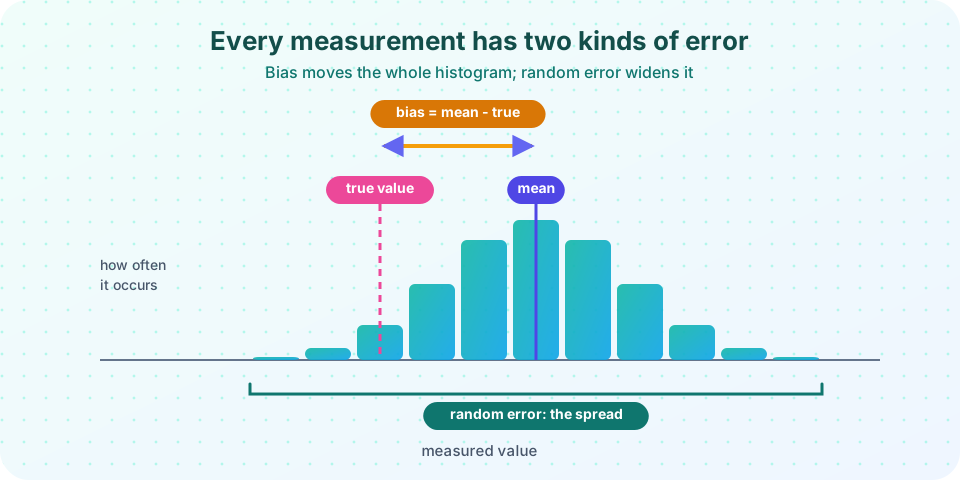
Measure the same thing five times and you will get five slightly different numbers. That is not a failure of your skill; it is a property of the world. Analytical chemistry takes this fact seriously. This chapter gives you the vocabulary and the tools to describe the scatter, to detect hidden bias, and to decide whether two results really differ.
What you will learn
- The two families of error and how each shows up in data.
- How to carry uncertainty through a calculation.
- How to summarize replicates with a mean, a standard deviation and a confidence interval.
- How to test whether two results, or a result and a reference value, are significantly different.
The chapter at a glance
Measure
Quantify
Decide
Lessons in this chapter
- Accuracy, precision and error propagation: kinds of error, significant figures and how uncertainties combine.
- Statistics of replicates: the mean, standard deviation, normal distribution and confidence intervals.
- Significance tests: t-test, F-test and Q test.
- Chapter 2 review: recap and a ten-question quiz.
Try it
Press Run (or Ctrl + Enter) to see the console output here.
No output.
Check your understanding
Quick check · 3 questions
of 3 answered You scored / 3 · perfect!
-
1. Which kind of error can be reduced by averaging many replicates?
Random errors scatter around the true value and partly cancel in a mean; a systematic error shifts every replicate the same way. -
2. A histogram is narrow but centered away from the true value. This indicates
Narrow means precise; off-center means biased, so not accurate. -
3. Statistics in analytical chemistry mainly helps you to
It quantifies scatter and supplies tests that replace guesswork.
Summary
- Every measurement has error; the task is to describe and limit it.
- Systematic error shifts results; random error spreads them.
- Chapter 2 gives you propagation rules, descriptive statistics and significance tests.
Track your progress
Create a free account to tick off lessons and pick up where you left off on any device.
of Analytical Chemistry lessons completed