


















Lesson 41 of 45 · Projects and Practice
Chapter 9 case studies: from sample to decision
Work through three complete analyses (lead by ICP-MS, caffeine by HPLC, chloride by potentiometric titration) from sampling to a reported, defensible decision.
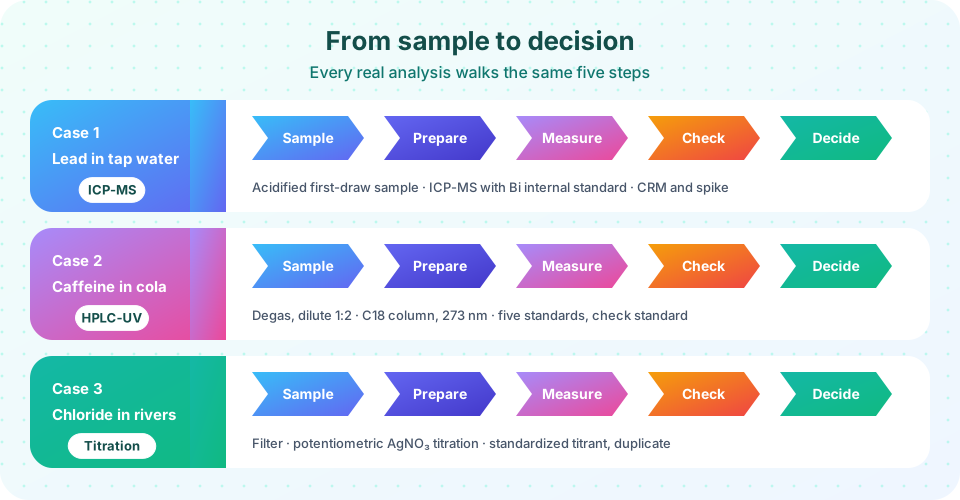
The earlier chapters taught the tools one by one. Real problems need them together. In this chapter we follow three complete analyses from the bottle to the report: a trace metal, an organic compound in a beverage and a major ion in natural water. Each runs through the same five steps: sample, prepare, measure, check, decide.
The numbers in the code are invented or generated by a model so that the arithmetic is clear. They are not measurements of any real water, drink or laboratory. Real methods always come with their own validation data.
What you will learn
- Plan an analysis from the question to the reported decision.
- Choose a method that matches the analyte, level and matrix.
- Calculate results with calibration, dilution and uncertainty.
- Decide whether a result complies with a limit when uncertainty is included.
Key terms
Fit for purpose: a method good enough, in accuracy and detection limit, for the decision to be made.
Dilution factor: the factor by which a sample was diluted before measurement.
Compliance decision: a statement that a result is above or below a limit, taking uncertainty into account.
Traceability: an unbroken chain of comparisons linking a result to a reference.
Five steps for every analysis
- Sample. Define the population and the decision. Take a representative sample in a clean container with the right preservative, and label it.
- Prepare. Dissolve, digest, dilute, filter or extract so that the analyte is in a form the instrument can measure.
- Measure. Calibrate with standards and measure samples bracketed by checks.
- Check. Look at blanks, spikes, duplicates, control charts and the internal-standard response.
- Decide. Calculate the result with its uncertainty and compare it with the limit or target.
Case 1: lead in tap water (ICP-MS)
Question. Does a household's tap water meet the WHO guideline value of 10 µg/L for lead?
Sample. Lead dissolves from old pipes and fittings, mostly when water stands. A "first-draw" sample is collected after a defined stagnation period, in an acid-washed bottle, and acidified with nitric acid to about 1 % so that lead stays dissolved.
Method. ICP-MS measures lead isotopes at ng/L levels with an internal standard such as bismuth to correct for drift and signal suppression. The calibration plots the ratio of lead to bismuth counts against concentration.
Check. Run a procedural blank, a calibration-verification standard, a spiked sample (recovery), and a certified reference water in the same batch.
Press Run (or Ctrl + Enter) to see the result here.
Program input · what you'd type while the program runs
Type the answers before you press Run, one per line. Each time the program reads a line (with input()), it gets the next line from this box.
Case 2: caffeine in a cola drink (HPLC-UV)
Question. How much caffeine does a cola contain, in mg/L and per can?
Sample and preparation. Carbonated drinks must be degassed (an ultrasonic bath works) because bubbles disturb the pump and the detector. Dilute 1:2 with water, then filter through a 0.45 µm membrane. Sugars and colorants are removed by the column; they do not need a separate cleanup.
Method. Caffeine absorbs strongly near 273 nm, so a reversed-phase C18 column with a water/methanol or water/acetonitrile mobile phase and UV detection is enough. Peak area against concentration gives a straight line.
Check. Run a check standard in the middle of the batch; if it differs from its nominal value by more than 2 %, repeat the calibration. Compare two replicate preparations of the drink; confirm the peak identity from the retention time and, with a diode array, its UV spectrum.
Press Run (or Ctrl + Enter) to see the result here.
Program input · what you'd type while the program runs
Type the answers before you press Run, one per line. Each time the program reads a line (with input()), it gets the next line from this box.
Case 3: chloride in river water (potentiometric titration)
Question. What is the chloride concentration in a water sample, and is it likely to affect corrosion or drinking-water taste?
Method. Chloride is titrated with standardized silver nitrate. A silver electrode against a reference electrode follows the potential, and the end point is found from the first derivative. Potentiometric detection avoids the subjective color change of the Mohr method and works in colored or turbid samples.
Preparation. Filter, adjust to a slightly acidic pH with nitric acid, and measure 50.00 mL into a beaker. Use duplicate portions.
Calculation. At the end point, moles of Ag⁺ added equal moles of Cl⁻:
c(Cl⁻) [mg/L] = V_ep × c(AgNO₃) × M(Cl) × 1000 / V_sample
with V_ep in mL, c in mol/L, M(Cl) = 35.45 g/mol and V_sample in mL.
Press Run (or Ctrl + Enter) to see the result here.
Program input · what you'd type while the program runs
Type the answers before you press Run, one per line. Each time the program reads a line (with input()), it gets the next line from this box.
Comparing the three cases
| Lead in water | Caffeine in cola | Chloride in water | |
|---|---|---|---|
| Level | µg/L | tens of mg/L | tens of mg/L |
| Why this method | Very low level, many other metals present | Organic analyte, complex matrix, needs a separation | Major ion, simple chemistry, high accuracy wanted |
| Calibration | Internal standard, 6 points | External, 5 points | Titrant standardized against a primary standard |
| Biggest risk | Contamination | Bubbles, co-eluting peaks | Interference by bromide, iodide, sulfide |
| Decision | Compare with 10 µg/L with uncertainty | Compare with label and tolerance | Compare with guideline or process limit |
Writing the report
A good analytical report states, in this order:
- what was asked and which sample was analyzed (identification, date, condition);
- the method used and any deviations;
- the result with units, the uncertainty and the coverage factor;
- QC evidence (blank, recovery, reference-material result);
- a clear conclusion that answers the original question;
- limitations, such as results valid only for that sample.
Common misconceptions
"The instrument reading is the result." The result is the instrument reading after calibration, dilution, blank correction and with an uncertainty.
"If the value is below the limit, the sample passes." Uncertainty matters; a value just below the limit may not be below it with confidence.
"One analyst, one run, one answer is enough." Duplicates, controls and checks catch the mistakes nobody expects.
Check your understanding
Quick check · 4 questions
of 4 answered You scored / 4 · perfect!
-
1. A drink was diluted 1:2 (50 mL sample + 50 mL water) and the diluted solution contained 48 mg/L. What is the concentration in the drink?
The dilution factor is 2, so the drink contains 2 × 48 = 96 mg/L. -
2. A lead result is 8.5 ± 2.0 µg/L (k = 2) against a limit of 10 µg/L. What is the correct statement?
8.5 + 2.0 = 10.5 exceeds the limit, so the interval straddles it. -
3. Why is a silver-electrode titration better than the Mohr color end point for a turbid sample?
The end point is read from a potential, which works in colored or turbid samples. -
4. 50.00 mL of water needs 3.41 mL of 0.01000 M AgNO3. What is the chloride concentration (M = 35.45 g/mol)?
3.41 × 0.01000 × 35.45 × 1000 / 50.00 = 24.2 mg/L.
Summary
- Every analysis: sample, prepare, measure, check, decide.
- Pick the method for the level, the matrix and the decision, then validate and control it.
- Compute results with calibration, dilution and uncertainty, and compare them with limits using a decision rule.
- A report is complete only with units, uncertainty, QC evidence and a conclusion.
Track your progress
Create a free account to tick off lessons and pick up where you left off on any device.
of Analytical Chemistry lessons completed