


















Lesson 18 of 45 · Titrations and Gravimetry
Acid-base titration curves and indicators
Calculate pH at each stage of strong and weak acid titrations, locate the equivalence point, read a titration curve and choose a suitable indicator.
A titration curve plots pH against the volume of titrant added. It is a map of the whole reaction: the starting pH, a gentle slope while a buffer forms, a sudden vertical jump at the equivalence point, and a plateau after it. If you can calculate and read the curve, you understand why an indicator works and which one to choose.
What you will learn
- Calculate the pH before, at and after the equivalence point for a strong acid-strong base titration.
- Do the same for a weak acid titrated with a strong base, using the Henderson-Hasselbalch equation.
- Predict the equivalence-point pH and pick an indicator.
- Recognize the buffer region and the half-equivalence point (pH = pKa).
Key terms
Titration curve: pH (or another signal) plotted against titrant volume.
Buffer region: the nearly flat part where weak acid and its conjugate base coexist.
Half-equivalence point: half the volume needed to reach equivalence; here pH = pKa.
Transition range: the pH interval over which an indicator changes color, about pKa(In) ± 1.
Henderson-Hasselbalch: pH = pKa + log([A⁻]/[HA]).
Strong acid with strong base
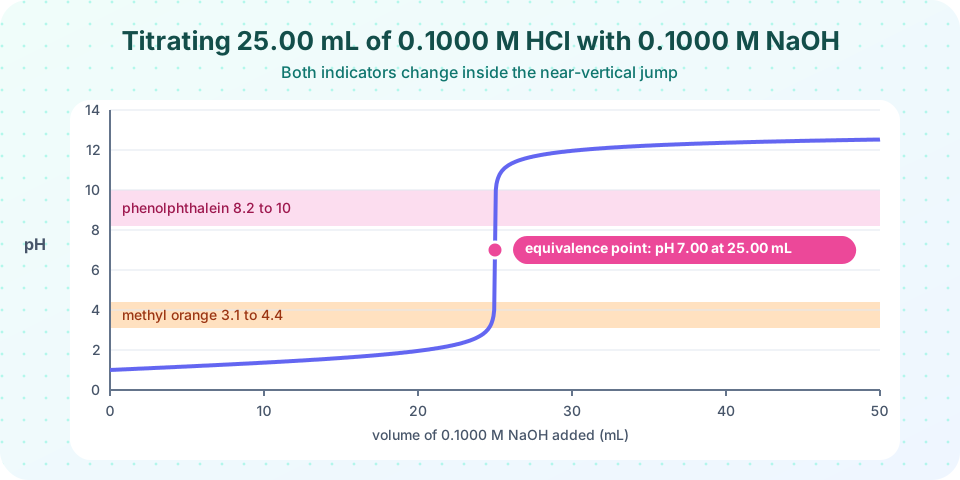
Take 25.00 mL of 0.1000 M HCl titrated with 0.1000 M NaOH. Initial moles of acid: 2.500 mmol.
- Before equivalence:
[H⁺] = (2.500 − 0.1000 V) mmol / (25.00 + V) mL. At V = 0: pH = 1.00. At V = 24.90 mL, unreacted H⁺ = 0.0100 mmol in 49.90 mL,[H⁺]= 2.00 × 10⁻⁴ M, pH = 3.70. - At equivalence (V = 25.00 mL): only NaCl is present; pH = 7.00 at 25 °C.
- After equivalence: excess OH⁻. At V = 25.10 mL: 0.0100 mmol in 50.10 mL gives
[OH⁻]= 2.00 × 10⁻⁴ M, pOH = 3.70, pH = 10.30. At V = 50.00 mL: 2.500 mmol in 75.00 mL gives[OH⁻]= 0.0333 M and pH = 12.52.
So pH jumps from 3.70 to 10.30 for the last 0.2 mL: that is the vertical step, and any indicator that changes between 4 and 10 gives an end point within a drop of the equivalence point.
Weak acid with strong base
Titrate 25.00 mL of 0.1000 M acetic acid (HA, K_a = 1.8 × 10⁻⁵, pK_a = 4.74) with 0.1000 M NaOH.
- Start:
[H⁺] ≈ √(K_a c) = √(1.8×10⁻⁵ × 0.1000) = 1.34 × 10⁻³ M, pH ≈ 2.87. - Buffer region (0 < V < 25 mL): some HA is converted to A⁻.
pH = pK_a + log(n_A⁻ / n_HA). At V = 12.50 mL (half-equivalence) the two are equal and pH = pK_a = 4.74. - Equivalence (V = 25.00 mL): only acetate (A⁻) is present, at 0.0500 M in 50.00 mL. It is a weak base:
K_b = K_w/K_a = 5.56 × 10⁻¹⁰,[OH⁻] = √(K_b × 0.0500) = 5.27 × 10⁻⁶ M, pOH = 5.28, pH = 8.72. - After equivalence: excess strong base controls the pH, as before. At 50.00 mL, pH = 12.52.
Two consequences: the jump is shorter (about pH 7.7 to 10.0 near the equivalence point), and the equivalence point is above 7. Phenolphthalein (8.2 to 10) fits perfectly; methyl orange (3.1 to 4.4) would change color long before the equivalence point and is a poor choice.
Choosing an indicator
An indicator is itself a weak acid HIn whose acid and base forms have different colors. Its color changes around pH = pK_In ± 1. Choose one whose transition range lies within the steep part of the curve, around the equivalence-point pH.
| Titration | Equivalence pH | Suitable indicator |
|---|---|---|
| strong acid + strong base | 7.0 | methyl orange, bromothymol blue, phenolphthalein |
| weak acid + strong base | above 7 (8 to 10) | phenolphthalein |
| weak base + strong acid | below 7 (4 to 6) | methyl orange, methyl red |
| very weak acid (K_a below 10⁻⁸) | no sharp jump | use a pH meter and a derivative plot |
A pH meter can replace the indicator: plot pH against volume, or the first derivative ΔpH/ΔV, whose maximum marks the equivalence point.
Common misconceptions
"The equivalence point is always at pH 7." It is 7 only for a strong acid with a strong base; weak acids give a basic equivalence point.
"The half-equivalence point is at pH 7." It is at pH = pK_a, which is where the weak acid and its conjugate base are equal.
"Any indicator works if it changes color." It must change inside the steep part of this curve.
Try it
Press Run (or Ctrl + Enter) to see the result here.
Program input · what you'd type while the program runs
Type the answers before you press Run, one per line. Each time the program reads a line (with input()), it gets the next line from this box.
Check your understanding
Quick check · 5 questions
of 5 answered You scored / 5 · perfect!
-
1. In a titration of a strong acid with a strong base, the pH at the equivalence point (25 °C) is
Only a neutral salt remains, so pH = 7.00. -
2. A weak acid has pKa = 4.74. At the half-equivalence point of its titration, the pH is
At half-equivalence [A⁻] = [HA], so log(1) = 0 and pH = pKa. -
3. Which indicator is best for titrating acetic acid with NaOH (equivalence pH 8.7)?
Its transition range includes the equivalence pH, in the steep part of the curve. -
4. 25.00 mL of 0.1000 M HCl plus 10.00 mL of 0.1000 M NaOH leaves how many mmol of H⁺?
2.500 − 1.000 = 1.500 mmol of H⁺ in 35.00 mL, [H⁺] = 0.0429 M, pH ≈ 1.37. -
5. Why does the pH of a weak acid solution rise only slowly in the buffer region?
A mixture of HA and A⁻ neutralizes small additions of base.
Summary
- A titration curve shows pH versus titrant volume; the steep jump marks the equivalence point.
- Strong acid with strong base: pH 7 at equivalence. Weak acid with strong base: above 7, with a buffer region and pH = pK_a at half-equivalence.
- Pick an indicator whose transition range lies in the steep part of the curve, or use a pH meter.
Track your progress
Create a free account to tick off lessons and pick up where you left off on any device.
of Analytical Chemistry lessons completed