


















Lesson 15 of 45 · Sampling and Calibration
Chapter 3 review: sampling and calibration
Review representative sampling, least-squares calibration, detection limits, standard addition and internal standards with a cheat sheet and a ten-question quiz.
Chapter 3 covered the two ends of every instrumental analysis: getting a representative portion in, and getting a trustworthy concentration out. Use this page to check you can connect them.
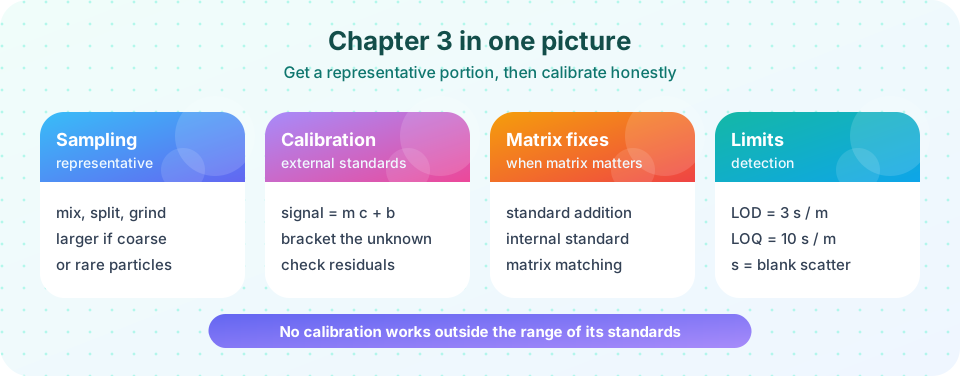
Recap table
| Lesson | Key ideas | Key formulas |
|---|---|---|
| Sampling heterogeneous materials | representative sample, grinding and splitting | RSD = √((1−p)/(np)), wR² = K_s |
| Calibration and detection limits | least squares, residuals, LOD, LOQ | y = mx + b, LOD = 3 s/m, LOQ = 10 s/m |
| Standard addition and internal standards | matrix effects, drift | c_x = b/m, F = (A_x/c_x)/(A_s/c_s) |
Try it
Press Run (or Ctrl + Enter) to see the result here.
Program input · what you'd type while the program runs
Type the answers before you press Run, one per line. Each time the program reads a line (with input()), it gets the next line from this box.
Check your understanding
Quick check · 10 questions
of 10 answered You scored / 10 · perfect!
-
1. Which is the most important step for a representative result from a heterogeneous solid?
Sampling variance dominates; only larger or better-reduced samples reduce it. -
2. K_s = 40 g. The sample mass for a sampling RSD of 2 % is
w = K_s/R² = 40/4 = 10 g. -
3. A calibration should
Interpolation within the calibration range is far safer than extrapolation. -
4. A calibration has r² = 0.9995 but residuals follow a smooth curve. You should
A high r² can coexist with curvature; patterned residuals reveal it. -
5. s_blank = 0.002 and m = 0.040 per ppm. LOQ (10 s/m) is
10 × 0.002 / 0.040 = 0.5 ppm. -
6. Which method corrects a proportional matrix effect?
Standard addition measures the slope inside the real matrix. -
7. An internal standard works because
Variations in injection volume or sensitivity act on both signals equally. -
8. A sample was diluted 1:25 before measurement and read 0.80 mg/L. The original concentration is
0.80 × 25 = 20 mg/L. -
9. Standard addition gives signals 0.10 at 0 ppm added and a slope of 0.025 per ppm. The unknown is
c_x = intercept/slope = 0.10/0.025 = 4 ppm. -
10. You want a lower LOD. Which change helps?
LOD = 3 s/m falls when m rises or s falls.
Summary
- Sampling dominates error for heterogeneous materials; size and splitting matter.
- Calibrate by least squares, check residuals, bracket the unknown, remember dilution factors.
- LOD and LOQ come from the blank noise and the slope.
- Use standard addition for matrix effects and internal standards for drift.
Track your progress
Create a free account to tick off lessons and pick up where you left off on any device.
of Analytical Chemistry lessons completed