


















Lesson 28 of 45 · Spectroscopic Methods
Infrared and fluorescence spectroscopy
Understand infrared spectroscopy and FTIR (bond vibrations, group frequencies, ATR) and fluorescence (Jablonski diagram, quantum yield, quenching).
UV-visible spectra are usually broad and tell you little about structure. Infrared spectroscopy is the opposite: a sharp, information-rich pattern that works like a fingerprint for molecules. Fluorescence offers a different strength. It detects extremely small amounts of a substance because it looks for light against a dark background.
This lesson covers both. First, vibrations: why each bond absorbs at its own frequency, and how to read an infrared spectrum. Then fluorescence: what happens to a molecule after it absorbs a photon, and why that makes it 100 to 1000 times more sensitive than absorption.
What you will learn
- Explain why bonds absorb infrared light and estimate band positions with Hooke's law.
- Read the main regions of an infrared spectrum and name common group frequencies.
- Describe FTIR and the ATR sampling technique.
- Use a Jablonski diagram to follow absorption, fluorescence and phosphorescence.
- Apply the linear range, inner filter effect and Stern–Volmer quenching.
Key terms
Vibrational transition: a jump between vibrational energy levels of a bond; infrared photons provide the energy.
Group frequency: the typical wavenumber range where a functional group absorbs.
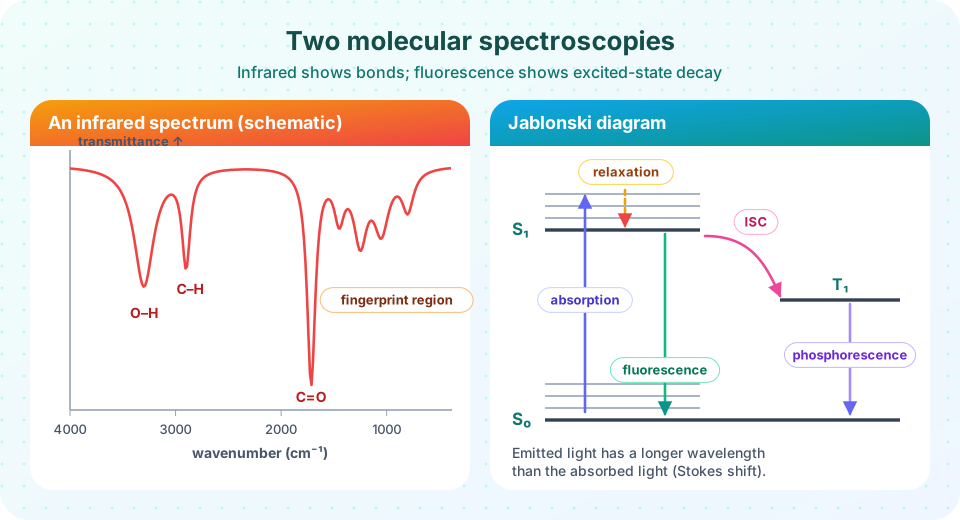
Fingerprint region: the complex region below about 1500 cm⁻¹ that is unique to each compound.
Quantum yield (Φ): photons emitted divided by photons absorbed.
Stokes shift: emission occurs at a longer wavelength than excitation.
Infrared spectroscopy
Bonds as springs
A chemical bond behaves roughly like a spring connecting two masses. It vibrates at a frequency that depends on the stiffness of the spring (the force constant k) and on the masses of the atoms through the reduced mass μ = m₁m₂/(m₁ + m₂). In wavenumber units,
ν̃ = (1 / 2πc) · √(k / μ)
Stiffer bonds and lighter atoms vibrate faster, so they absorb at higher wavenumber. A triple bond (C≡C, C≡N) is stiffer than a double bond (C=O, C=C), which is stiffer than a single bond, and bonds to hydrogen sit at the highest values because hydrogen is so light. Replacing H with deuterium shifts a stretch to lower wavenumber by roughly a factor of √2.
An infrared photon is absorbed only if the vibration changes the dipole moment of the molecule. This is why O–H, C=O and N–H bands are strong, while symmetrical stretches like N≡N in N₂ are invisible.
Press Run (or Ctrl + Enter) to see the result here.
Program input · what you'd type while the program runs
Type the answers before you press Run, one per line. Each time the program reads a line (with input()), it gets the next line from this box.
The numbers come out close to real values (about 3000 for C–H, 1700 for C=O), but a spring model is only an approximation; this is a calculator that applies the formula, not a measured spectrum.
Reading a spectrum
Infrared spectra are plotted as transmittance (or absorbance) against wavenumber, with high wavenumber on the left. Work from left to right through three questions.
| Region (cm⁻¹) | What to look for |
|---|---|
| 3600–3200 | O–H (broad, strong in alcohols and acids) and N–H (sharper, often two peaks in primary amines) |
| 3300–2700 | C–H stretches: ≡C–H near 3300, =C–H just above 3000, sp³ C–H just below 3000, aldehyde C–H near 2720 |
| 2300–2100 | Triple bonds: C≡N (2260–2210), C≡C (2260–2100) |
| 1800–1650 | C=O: ketones near 1715, aldehydes near 1725, esters near 1735, amides near 1650, carboxylic acids 1725–1700 |
| 1680–1600 | C=C stretches, aromatic ring modes 1600–1450 |
| below 1500 | Fingerprint region: C–O, C–N, bending modes; compare with a reference library |
A strong peak near 1715 cm⁻¹ with a broad band covering 3000–2500 cm⁻¹ suggests a carboxylic acid. A single strong peak at 1715 cm⁻¹ and nothing above 3100 cm⁻¹ except sharp C–H suggests a ketone. Always confirm with other methods, because a spectrum rarely identifies an unknown on its own.
FTIR and ATR
Modern instruments are Fourier-transform infrared (FTIR) spectrometers. A Michelson interferometer with a moving mirror encodes all wavelengths at once, and a Fourier transform converts the signal to a spectrum. All wavelengths are measured simultaneously, so scans are fast and have a better signal-to-noise ratio.
Attenuated total reflectance (ATR) made sampling easy. A drop of liquid or a piece of solid is pressed against a crystal (diamond, zinc selenide or germanium). The beam reflects inside the crystal and its evanescent wave penetrates a micrometer or so into the sample. No dilution or pellet is needed. The older alternatives are a KBr pellet for solids and a liquid cell with salt windows.
Fluorescence
What happens after absorption
In a Jablonski diagram, horizontal lines are electronic states (S₀ is the ground singlet, S₁ the first excited singlet, T₁ the first triplet), and thinner lines inside each are vibrational levels. After absorption (about 10⁻¹⁵ s), the molecule quickly loses vibrational energy as heat (vibrational relaxation, picoseconds) and sinks to the bottom of S₁. From there it may:
- fluoresce, emitting a photon in about 10⁻⁹–10⁻⁷ s;
- lose energy as heat (internal conversion) or to other molecules (quenching);
- cross to the triplet state (intersystem crossing) and then emit slowly as phosphorescence over milliseconds to seconds.
Because energy was lost to relaxation, the emitted photon has less energy and a longer wavelength than the absorbed one. The difference is the Stokes shift. It lets the detector separate emission from the exciting light.
The quantum yield Φ is the fraction of absorbed photons that are re-emitted as fluorescence, between 0 and 1. A classic reference is quinine sulfate in dilute sulfuric acid, excited near 350 nm and emitting near 450 nm.
Fluorescence intensity and concentration
The emitted intensity is proportional to the absorbed light and to Φ:
F = k Φ I₀ (1 − 10^(−ε b c))
For a dilute solution (A = ε b c < 0.05) the exponential can be expanded, giving F ≈ 2.303 k Φ I₀ ε b c, a straight line through the origin. This explains the sensitivity: you can raise I₀ with a strong lamp or a laser, which absorbance cannot do. Detection limits reach the nanomolar range and below.
At higher concentration two problems appear. The inner filter effect means the sample absorbs the excitation light before it reaches the center of the cell, or reabsorbs the emitted light. The curve bends over and may even fall. Work with absorbance below about 0.05 at the excitation wavelength or dilute the sample.
Press Run (or Ctrl + Enter) to see the result here.
Program input · what you'd type while the program runs
Type the answers before you press Run, one per line. Each time the program reads a line (with input()), it gets the next line from this box.
Quenching and the Stern–Volmer equation
A quencher (for example dissolved oxygen, iodide, or heavy ions) deactivates excited molecules and lowers the fluorescence. For dynamic quenching:
F₀ / F = 1 + K_SV [Q]
A plot of F₀/F against the quencher concentration is a straight line with slope K_SV. Oxygen quenching is the reason that careful fluorescence work often purges solutions with nitrogen.
Press Run (or Ctrl + Enter) to see the result here.
Program input · what you'd type while the program runs
Type the answers before you press Run, one per line. Each time the program reads a line (with input()), it gets the next line from this box.
Instruments and uses
A spectrofluorometer measures emission at 90 degrees to the excitation beam, which keeps the exciting light out of the detector. It has two monochromators: one picks the excitation wavelength and one scans the emission. Applications include vitamins (riboflavin, thiamine after conversion), polycyclic aromatic hydrocarbons in water, chlorophyll in lake water, and fluorescent tags on DNA and proteins.
Common misconceptions
"Every molecule fluoresces." Most do not. Rigid, conjugated, aromatic molecules do, and many analytes are made to fluoresce by adding a fluorescent tag.
"Fluorescence and phosphorescence are the same." Fluorescence is fast (nanoseconds) and ends when the light is switched off. Phosphorescence involves a spin change and can last seconds.
"A strong IR band means a high concentration." Intensity depends on the change of dipole moment too. Compare peaks of the same compound, not bands of different groups.
Check your understanding
Quick check · 5 questions
of 5 answered You scored / 5 · perfect!
-
1. Which bond is expected to absorb at the highest wavenumber?
Bonds to hydrogen have the smallest reduced mass, so they vibrate and absorb at the highest wavenumber, about 3200–3600 cm⁻¹ for O–H. -
2. A spectrum shows a strong sharp peak at 1715 cm⁻¹ and no broad band above 3200 cm⁻¹. Which compound class is most likely?
A strong C=O stretch near 1715 cm⁻¹ with no O–H band suggests a ketone. -
3. Why does fluorescence have a Stokes shift?
Vibrational relaxation drains energy before the photon is emitted, so the emitted wavelength is longer. -
4. Why is fluorescence often more sensitive than absorption?
Because you detect emitted light against a near-zero background, the signal can be amplified, and I₀ can be raised. -
5. In a Stern–Volmer plot, what does the slope give?
F₀/F = 1 + K_SV[Q], so the slope of the line is K_SV.
Summary
- Bonds vibrate like springs;
ν̃ = (1/2πc)√(k/μ); hydrogen bonds and triple bonds absorb at high wavenumber. - IR band positions identify functional groups; the fingerprint region identifies the compound.
- FTIR measures all wavelengths at once, and ATR needs almost no sample preparation.
- Fluorescence follows absorption, relaxation and emission at a longer wavelength;
Fis linear inconly at low absorbance. - Quenchers lower fluorescence according to
F₀/F = 1 + K_SV[Q].
Next: Atomic spectroscopy
Track your progress
Create a free account to tick off lessons and pick up where you left off on any device.
of Analytical Chemistry lessons completed