


















Lesson 10 of 45 · Measurement, Error and Statistics
Chapter 2 review: measurement, error and statistics
Review accuracy, precision, error propagation, confidence intervals and significance tests with a one-page cheat sheet, recap table and ten-question quiz.
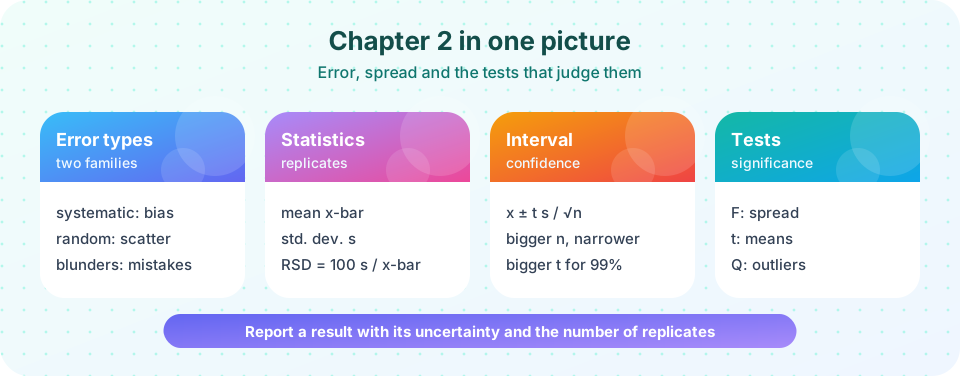
This chapter gave you the machinery for saying how much to trust a number. Before moving to sampling and calibration, check that the pieces fit together.
Recap table
| Lesson | Key ideas | Formula |
|---|---|---|
| Accuracy and propagation | bias, scatter, blunders; significant figures | sums: absolute in quadrature; products: relative in quadrature |
| Statistics of replicates | mean, s, RSD, bell curve | x̄ ± t s / √n |
| Significance tests | t, F, Q | t = abs(x̄ − μ) √n / s, F = s₁²/s₂², Q = gap/range |
Try it
Press Run (or Ctrl + Enter) to see the result here.
Program input · what you'd type while the program runs
Type the answers before you press Run, one per line. Each time the program reads a line (with input()), it gets the next line from this box.
Check your understanding
Quick check · 10 questions
of 10 answered You scored / 10 · perfect!
-
1. Which error is revealed by analyzing a certified reference material?
A CRM has a known true value, so a consistent offset shows as bias. -
2. The relative uncertainties of three independent factors are 1 %, 2 % and 2 %. The relative uncertainty of their product is
√(1 + 4 + 4) = 3 %. -
3. 0.0250 has how many significant figures?
The leading zeros do not count; 2, 5 and the trailing 0 after the decimal point do. -
4. The standard deviation of the mean of n replicates is
Averaging reduces the uncertainty by √n. -
5. For n = 6 and 95 % confidence, which t value is used (2.571, 2.447, 2.365)?
Degrees of freedom are n − 1 = 5, and t(95 %, 5) = 2.571. The value 2.447 belongs to 6 degrees of freedom. -
6. Which test compares the precision of two methods?
The F-test compares two variances. -
7. Results: 3.10, 3.12, 3.11, 3.13, 3.30. Q = 0.85 and the 90 % critical value for n = 5 is 0.642. The suspect value is
Q exceeds the critical value, so rejection is supported, but only with a documented reason in practice. -
8. A narrow confidence interval means
The interval reflects random scatter and n; bias is invisible in it. -
9. A t-test gives p = 0.30. At α = 0.05 you conclude
p > α, so H₀ is not rejected. -
10. The best way to halve a confidence interval, without changing s, is to
The width scales as 1/√n.
Summary
- Distinguish bias from scatter, and propagate uncertainty in quadrature.
- Describe replicates by mean, s, RSD and a t-based interval.
- Use t, F and Q tests to make decisions, and discard data only with cause.
Track your progress
Create a free account to tick off lessons and pick up where you left off on any device.
of Analytical Chemistry lessons completed