


















Lesson 7 of 45 · Measurement, Error and Statistics
Accuracy, precision and error propagation
Tell accuracy from precision, classify systematic, random and gross errors, use significant figures, and propagate uncertainty through sums and products.
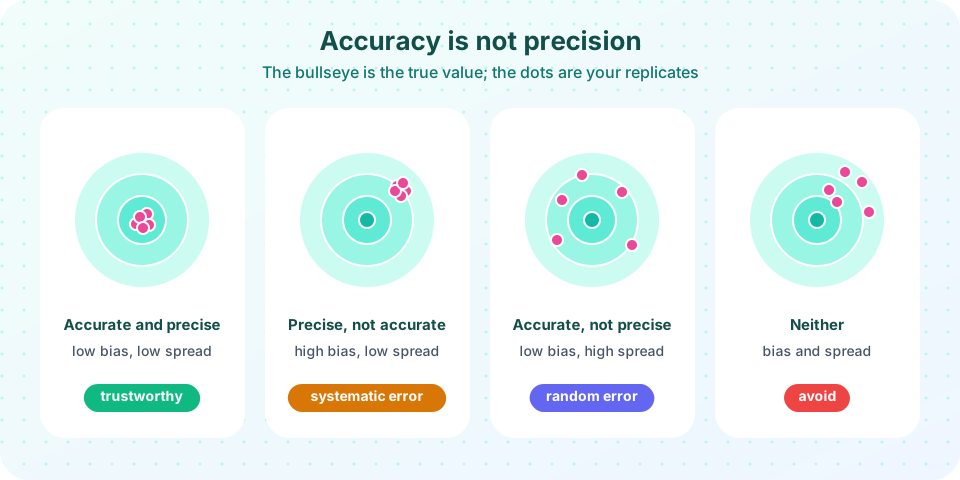
Two students titrate the same acid. One reports 0.1006 M every time, but the true concentration is 0.1100 M. The other gets 0.103, 0.118, 0.109, 0.112: scattered but centered on the truth. Who is better? The answer depends on what you mean by "better", and that is why chemists separate accuracy from precision. This lesson defines them, classifies errors, and shows how an uncertainty in each input becomes an uncertainty in the result.
What you will learn
- Define accuracy, precision, absolute error and relative error.
- Distinguish systematic, random and gross errors and how to find each.
- Round results with the right number of significant figures.
- Propagate uncertainties through addition, subtraction, multiplication and division.
Key terms
Accuracy: closeness of a result to the true (or accepted) value; quantified by the bias.
Precision: closeness of repeated results to each other; quantified by the standard deviation.
Absolute error: E = measured − true, with the unit of the quantity.
Relative error: E / true, often in percent.
Significant figures: the digits that carry information; the last one is uncertain.
Kinds of error
- Systematic (determinate) error pushes every result the same way: an uncalibrated pipette, an impure standard, an indicator that changes color early. It does not shrink with more replicates. You find it by analyzing a certified reference material (CRM), comparing with an independent method, or varying the sample size.
- Random (indeterminate) error scatters results unpredictably: reading a meter, electronic noise, small temperature changes. It follows a bell-shaped distribution and shrinks as
1/√nwhen you average. - Gross errors (blunders): spilling, misreading a scale, using the wrong reagent. They are not statistics, they are mistakes; repeat the measurement.
Absolute and relative error. If the true concentration is 0.1100 M and you found 0.1006 M, the absolute error is −0.0094 M and the relative error is −8.5 %. Relative error lets you compare quantities of different sizes.
Significant figures
A significant figure is a digit you can trust, plus one estimated digit. A burette reading of 24.80 mL has four significant figures; 24.8 mL has three. Rules to remember:
- Leading zeros are not significant (0.0035 has two). Trailing zeros after a decimal point are (2.50 has three).
- Addition and subtraction: the result has as many decimal places as the least precise number. 12.11 + 0.3 = 12.4.
- Multiplication and division: the result has as many significant figures as the factor with the fewest. 4.18 × 2.0 = 8.4.
- Keep one or two extra digits in intermediate steps and round only the final answer.
Propagation of uncertainty
Let s_x be the standard uncertainty of a quantity. For independent inputs:
- Sums and differences:
y = a + b − cgivess_y = √(s_a² + s_b² + s_c²). Absolute uncertainties combine in quadrature. - Products and quotients:
y = a × b / cgives(s_y/y) = √((s_a/a)² + (s_b/b)² + (s_c/c)²). Relative uncertainties combine in quadrature. - Powers:
y = a^ngivess_y/y = |n| s_a/a.
Worked example
You prepare a standard by weighing 0.7305 g of NaCl (±0.0002 g), using M = 58.44 g/mol (±0.01) in a 250.0 mL flask (±0.12 mL tolerance treated as the uncertainty, 0.00012 L; this is a simplification). The concentration is c = m / (M × V) = 0.7305 / (58.44 × 0.2500) = 0.05000 mol/L.
Relative uncertainties: mass 0.0002/0.7305 = 0.027 %; molar mass 0.01/58.44 = 0.017 %; volume 0.12/250.0 = 0.048 %. Combined: √(0.027² + 0.017² + 0.048²) % = 0.058 %. So c = 0.05000 ± 0.00003 mol/L. Notice that the flask contributes most, so a better balance would not improve anything: attack the largest term.
Common misconceptions
"Precise means correct." A precise method can be badly biased.
"More digits on the display mean a better result." The last digits may be noise; the significant figures must reflect the uncertainty.
"Add uncertainties directly." Independent random uncertainties add in quadrature, which is smaller than the plain sum.
Try it
Press Run (or Ctrl + Enter) to see the result here.
Program input · what you'd type while the program runs
Type the answers before you press Run, one per line. Each time the program reads a line (with input()), it gets the next line from this box.
Press Run (or Ctrl + Enter) to see the console output here.
No output.
Check your understanding
Quick check · 5 questions
of 5 answered You scored / 5 · perfect!
-
1. A student reports 0.1006 M five times; the true value is 0.1100 M. The method is
Identical results are precise; the 8.5 % gap from the truth is bias. -
2. Which error does NOT shrink when you average more replicates?
A systematic error pushes every replicate the same way, so averaging leaves it in place. -
3. 12.11 + 0.3 + 4.226 should be reported as
The least precise term, 0.3, has one decimal place, so the answer has one: 16.6. -
4. A result uses a = 10.0 ± 0.1 and b = 5.0 ± 0.1 in y = a × b. The relative uncertainty of y is about
Relative: 1 % and 2 %. √(1² + 2²) = √5 ≈ 2.2 %. -
5. What is a certified reference material used for?
Analyzing a material with a known certified value reveals bias in your method.
Summary
- Accuracy = closeness to the truth; precision = closeness among replicates.
- Systematic error is bias, random error is scatter, gross errors are mistakes.
- Round sums by decimal places and products by significant figures.
- Independent uncertainties combine in quadrature; find the largest term and improve it.
Next: Statistics of replicates
Track your progress
Create a free account to tick off lessons and pick up where you left off on any device.
of Analytical Chemistry lessons completed