


















Lesson 39 of 45 · Mass Spectrometry and Quality Assurance
Method validation and quality control
Learn how analytical methods are validated: selectivity, linearity, accuracy, precision, LOD and LOQ, plus control charts, reference materials and proficiency testing.
Imagine two laboratories reporting lead in the same tap water. One says 8 µg/L and the other 14 µg/L. The limit is 10 µg/L. Who is right? The question cannot be answered until each laboratory can show how good its method is: how close it gets to the truth, how repeatable it is, how low it can go, and how it is watched from day to day.
Method validation is the planned study that proves a method is fit for its purpose. Quality control is the continuous monitoring that shows the validated method still works. Together they give a result the weight of evidence.
What you will learn
- List the performance characteristics checked in a validation.
- Calculate accuracy (recovery), precision (RSD), LOD and LOQ.
- Build and read a Shewhart control chart.
- Use certified reference materials and proficiency testing.
- Explain measurement uncertainty and how it is reported.
Key terms
Accuracy: closeness of the result to the true (or accepted reference) value.
Precision: closeness of repeated results to each other, usually as %RSD.
LOD / LOQ: the lowest amount that can be detected / quantified with acceptable certainty.
CRM: certified reference material, a material with certified values and stated uncertainty.
Measurement uncertainty: an interval around the result within which the true value is expected to lie.
What is validated
International guidelines (for example ICH Q2 for pharmaceuticals, and the general ISO/IEC 17025 requirement to validate methods) ask for a set of performance characteristics. Which ones are needed depends on what the method is for.
| Characteristic | Question it answers | Typical evidence |
|---|---|---|
| Selectivity / specificity | Does the signal belong only to the analyte? | Blanks, spiked samples, interferents, peak purity |
| Linearity and range | Does response follow concentration over the working range? | 5–6 standards, residual plot |
| Accuracy (trueness) | How close to the truth? | Recovery of spikes, CRM, comparison with a reference method |
| Precision | How repeatable? | Replicates: repeatability, intermediate precision, reproducibility |
| LOD, LOQ | How low can it go? | Noise or calibration statistics |
| Robustness | Does it survive small changes (pH, temperature, flow)? | Deliberate variations |
| Stability | Do samples and standards keep? | Storage tests |
Linearity and range
A high r² is not enough. A curved calibration can still have r² = 0.998. Plot the residuals (measured minus fitted). They should scatter randomly around zero. A pattern, such as a smile or a funnel, signals non-linearity or unequal variance. The working range runs from the LOQ up to the highest standard for which linearity, accuracy and precision are acceptable.
Accuracy and precision
Accuracy is tested by recovery: spike a blank matrix with a known amount, analyze it, and compute
recovery (%) = found / added × 100
Acceptance ranges depend on the concentration; for assay of a drug at 100 % level it might be 98–102 %, while for trace residues 70–120 % is common. A CRM gives an independent check of trueness.
Precision is reported as the relative standard deviation, %RSD = s / mean × 100. Three levels matter:
- Repeatability: same analyst, same instrument, same day.
- Intermediate precision: different days, analysts or instruments in one laboratory.
- Reproducibility: different laboratories (collaborative study).
Precision gets worse as concentration falls: the Horwitz curve, an empirical rule, predicts reproducibility RSD of about 2 % at 100 % and 16 % at 1 mg/kg.
Limits of detection and quantitation
There are three common ways to estimate them:
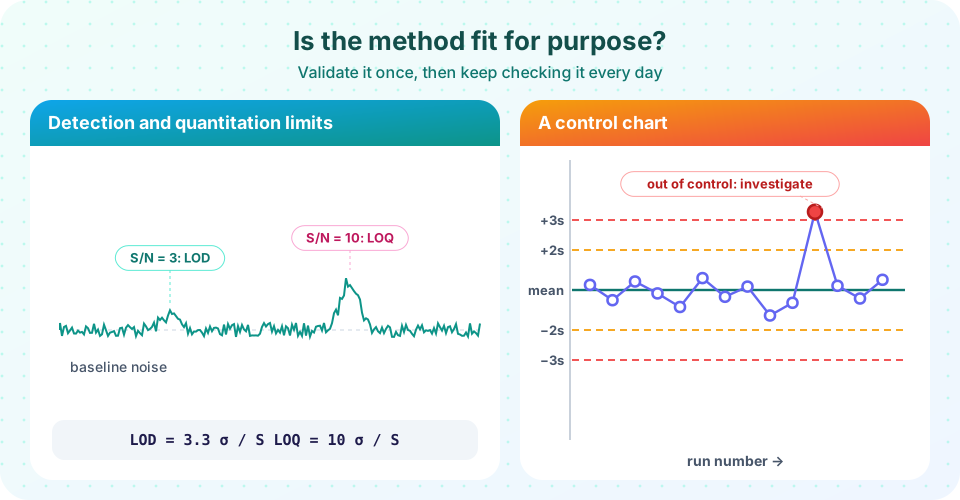
- Signal-to-noise: LOD at
S/N = 3, LOQ atS/N = 10. Fast for chromatography. - Blank statistics:
LOD = 3 × s_blank / slope,LOQ = 10 × s_blank / slope. - Calibration statistics (ICH):
LOD = 3.3 σ / SandLOQ = 10 σ / S, whereσis the residual standard deviation of the regression (or the standard deviation of the intercept) andSis the slope.
Always confirm an estimated LOQ by analyzing samples near that concentration and checking precision and recovery.
Press Run (or Ctrl + Enter) to see the result here.
Program input · what you'd type while the program runs
Type the answers before you press Run, one per line. Each time the program reads a line (with input()), it gets the next line from this box.
Quality control during routine work
After validation, every batch carries controls.
- Method blank: a sample without analyte carried through the whole procedure. It reveals contamination.
- Calibration verification: a standard analyzed at intervals to confirm the calibration still holds.
- Duplicates: two portions of one sample to check precision.
- Spiked sample (matrix spike): a known addition to a real sample to check recovery in the actual matrix.
- Control sample or CRM: a material with a known value, analyzed in each batch.
Control charts
A Shewhart control chart plots the QC result against the run number, with a centre line at the mean and limits from the standard deviation s of a stable period. The warning limits are at mean ± 2s and the action limits at mean ± 3s. For a stable process about 95 % of points lie within the warning limits and 99.7 % within the action limits.
Common rules for "out of control":
- one point beyond
±3s; - two consecutive points beyond
±2son the same side; - several consecutive points (for example eight or more) on one side of the mean, which signals a shift;
- a steady upward or downward trend, which signals drift.
When a rule is broken, stop reporting results, find the cause (a new reagent, a worn column, contaminated standard), correct it and repeat the batch.
Press Run (or Ctrl + Enter) to see the result here.
Program input · what you'd type while the program runs
Type the answers before you press Run, one per line. Each time the program reads a line (with input()), it gets the next line from this box.
Reference materials and proficiency testing
A certified reference material (CRM) is a stable, homogeneous material whose property values are certified by a metrologically valid procedure, with a stated uncertainty and traceability. It could be a river-water sample with certified lead, or a standard of caffeine in coffee. Analyzing a CRM tests trueness; if your result lies within the certified range (taking both uncertainties into account), the method is accurate for that matrix.
Proficiency testing (PT) or interlaboratory comparison sends identical samples to many laboratories and compares the results. The performance score is a z-score:
z = (x − X_assigned) / σ_p
where x is your result, X the assigned value and σ_p the standard deviation for proficiency assessment. Typical interpretation: |z| ≤ 2 is satisfactory, 2 < |z| < 3 questionable, |z| ≥ 3 unsatisfactory. Accreditation bodies require regular participation.
Measurement uncertainty
Every result has an uncertainty. Following the GUM (Guide to the Expression of Uncertainty in Measurement), you list the sources (weighing, volumetric glassware, calibration, repeatability, recovery), estimate each as a standard uncertainty, and combine them. For independent sources, the combined standard uncertainty is the root sum of squares:
u_c = √(u₁² + u₂² + u₃² + ...)
The expanded uncertainty U = k · u_c uses a coverage factor k = 2 for roughly 95 % confidence. A result is reported as, for example, 10.2 ± 0.6 mg/L (k = 2). If a legal limit lies within the interval, a compliance statement needs a decision rule agreed in advance. In practice, laboratories often use their validation and QC data (the "top-down" approach) to estimate the uncertainty.
Common misconceptions
"If r² is above 0.99 the method is linear." Check residual plots and back-calculate each standard; curved data can have a high r².
"Validation is a one-time job." Changes to the matrix, instrument or reagents may need revalidation, and QC must continue.
"LOD is the lowest concentration I can report." Below the LOQ you may say 'detected', but not give a reliable number.
"A z-score of 1.8 means my method is fine." One result is not a trend; track z-scores over time.
Check your understanding
Quick check · 5 questions
of 5 answered You scored / 5 · perfect!
-
1. A spiked sample contains 10.0 mg/L added analyte and the method finds 9.4 mg/L. What is the recovery?
Recovery = found/added × 100 = 9.4/10.0 × 100 = 94 %. -
2. A calibration has a slope of 50 response units per ng/mL and a residual standard deviation of 4.0 units. What is the LOD by the ICH formula?
LOD = 3.3 × 4.0 / 50 = 0.264 ng/mL. -
3. Which pattern on a control chart signals a shift in the method?
A run of eight or more points on one side of the mean is unlikely by chance and signals a shift. -
4. A laboratory receives z = −2.6 in a proficiency test. How is this usually judged?
2 < |z| < 3 is questionable and calls for review. -
5. Which source of evidence checks the trueness of a method independently?
A CRM has an independently certified value, so agreement shows the method gives true results for that matrix.
Summary
- Validation shows a method is fit for purpose: selectivity, linearity, accuracy, precision, LOD/LOQ, robustness.
- Recovery measures accuracy; %RSD measures precision;
LOD = 3.3σ/S,LOQ = 10σ/S. - QC runs with every batch: blanks, spikes, duplicates, control samples and control charts.
- CRMs test trueness; proficiency testing compares laboratories via z-scores.
- Report results with an expanded uncertainty,
U = k·u_c, usuallyk = 2.
Next: Chapter 8 review
Track your progress
Create a free account to tick off lessons and pick up where you left off on any device.
of Analytical Chemistry lessons completed