


















Lesson 9 of 45 · Measurement, Error and Statistics
Significance tests: t-test, F-test and Q test
Decide whether a result differs from a reference value, whether two methods agree, and whether a suspicious point is an outlier, using the t-test, F-test and Q test.
You analyze a certified reference material and get a mean of 11.62 ppm against a certified 12.00 ppm. Is your method biased, or is that just the scatter you would expect? A significance test answers such questions with a rule instead of a hunch: assume nothing is going on (the null hypothesis), compute how surprising your data would be under that assumption, and compare with a threshold.
What you will learn
- State a null hypothesis and interpret a significance level.
- Compare a mean with a known value, and two means with each other (t-test).
- Compare two standard deviations (F-test).
- Test one suspect data point with the Q test, and know why to be careful.
Key terms
Null hypothesis (H₀): the statement of "no difference" that you test. Significance level (α): the chance of wrongly rejecting H₀; usually 0.05. p-value: the probability of results at least this extreme if H₀ were true. Critical value: the threshold the calculated statistic must exceed to reject H₀. Pooled standard deviation: a combined s from two data sets with similar precision.
The logic
Choose α (0.05 is typical, meaning 95 % confidence). Calculate a test statistic. If it exceeds the critical value, or equivalently if p < α, the difference is statistically significant; otherwise you have no evidence of a difference, which is not proof of equality, only that the data are not enough to tell.
Test 1: a mean against a known value
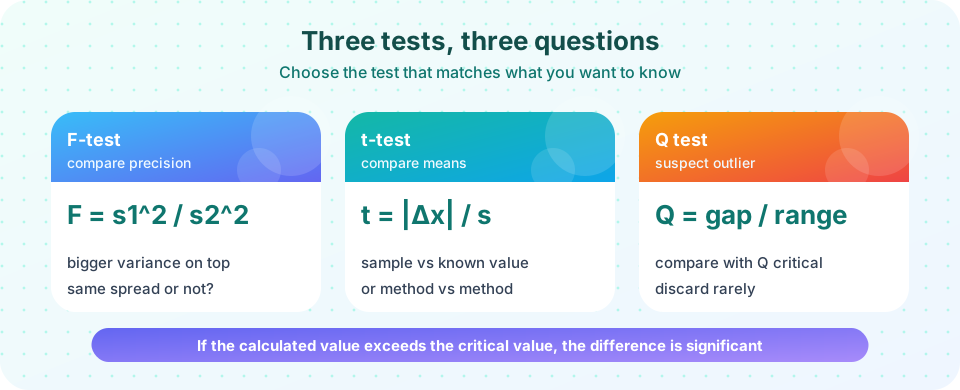
t_calc = |x̄ − μ| √n / s, with ν = n − 1 degrees of freedom.
Example: five analyses of a CRM certified at 12.00 ppm give 11.6, 11.8, 12.1, 11.5, 11.9 (mean 11.78, s ≈ 0.239). Then t_calc = 0.22 × 2.236 / 0.239 ≈ 2.06. The critical value for ν = 4 at 95 % (two-sided) is 2.776. Since 2.06 < 2.776, there is no significant evidence of bias. (The run below confirms this.)
Test 2: comparing two means
For two sets with similar spread, the pooled standard deviation is s_pool = √( ((n₁−1)s₁² + (n₂−1)s₂²) / (n₁+n₂−2) ) and
t_calc = |x̄₁ − x̄₂| / ( s_pool √(1/n₁ + 1/n₂) ), with ν = n₁ + n₂ − 2.
Only use this pooled version if the standard deviations are comparable, which is what the F-test checks. If they are not, use Welch's version (SciPy: equal_var=False). If the samples are paired (the same specimens measured by two methods), use a paired t-test on the differences, which removes the sample-to-sample variation.
Test 3: comparing precision (F-test)
F = s₁² / s₂², with the larger variance in the numerator so F ≥ 1. Compare with the critical F for (ν₁, ν₂) degrees of freedom. For example, with 6 and 6 replicates (5 and 5 degrees of freedom) the 95 % one-sided critical value is 5.05. If F_calc exceeds it, the precisions differ significantly.
Test 4: an outlier (Q test)
Q = gap / range, where gap is the distance between the suspect value and its nearest neighbor and range is highest minus lowest. For results 12.47, 12.48, 12.49, 12.51, 12.80: gap = 0.29, range = 0.33, Q = 0.88. The 90 % critical values are 0.941 (n = 3), 0.765 (4), 0.642 (5), 0.560 (6), 0.507 (7), 0.468 (8), 0.437 (9), 0.412 (10). For n = 5, 0.88 > 0.642, so 12.80 can be rejected at the 90 % level.
Be careful with outlier tests. The Q test is weak for small n, and rejecting data changes your result. Only discard a point if you also have a physical reason (a recorded mistake), and say so in the report. Never test and discard repeatedly.
Common misconceptions
"p = 0.05 means a 95 % chance the hypothesis is true." The p-value is about the data given H₀, not about H₀ itself.
"Not significant means equal." It means the data cannot distinguish them; a larger sample might.
"Significant means important." A tiny but real bias can be significant and chemically irrelevant.
Try it
Press Run (or Ctrl + Enter) to see the result here.
Program input · what you'd type while the program runs
Type the answers before you press Run, one per line. Each time the program reads a line (with input()), it gets the next line from this box.
Press Run (or Ctrl + Enter) to see the console output here.
No output.
Check your understanding
Quick check · 5 questions
of 5 answered You scored / 5 · perfect!
-
1. In a t-test, t_calc is smaller than t_critical. The proper conclusion is
Failing to reject H₀ means the data do not show a difference; it does not prove equality. -
2. Which test checks whether two methods have the same precision?
The F-test compares variances: F = s₁²/s₂² (larger on top). -
3. Why should the F-test come before the pooled two-sample t-test?
The pooled standard deviation is only meaningful if the two spreads are comparable. -
4. Five results: 5.01, 5.02, 5.03, 5.04, 5.30. Q for 5.30 is (critical 0.642 at 90 %, n = 5):
gap = 0.26, range = 0.29, Q = 0.897 > 0.642, so the point is rejected at 90 % confidence (with caution about discarding data). -
5. The same ten samples are analyzed by two methods. Which test is appropriate for the difference between the methods?
Samples differ in concentration; pairing removes that variation and tests the mean of the paired differences.
Summary
- A significance test compares a calculated statistic with a critical value at a chosen α.
- t-tests compare means; the F-test compares variances; the Q test screens a suspect value.
- Failing to find a difference is not proof of equality, and significant is not the same as important.
- Discard data only for documented reasons.
Next: Chapter 2 review
Track your progress
Create a free account to tick off lessons and pick up where you left off on any device.
of Analytical Chemistry lessons completed