


















Lesson 27 of 46 · Inequality: Class, Race and Gender
Social Class and Mobility
Compare Marx, Weber and Bourdieu on class, learn to read a Lorenz curve and Gini coefficient, and simulate how much social mobility parents' income allows.
What is a social class? Is it how much money you have, what you do for a living, how you speak, or who you know? Sociologists have given different answers, and each answer highlights something real. This lesson compares three classic theories, then gives you the two standard tools for measuring inequality, the Lorenz curve and the Gini coefficient, and finally asks how easily people move between classes from one generation to the next.

What you will learn
- Compare Marx's, Weber's and Bourdieu's concepts of class.
- Read a Lorenz curve and compute a Gini coefficient.
- Distinguish absolute from relative mobility and intergenerational from intragenerational mobility.
- Use a simple model to see how parent-child income links limit mobility.
Key terms
Means of production: the factories, land and tools used to produce goods (Marx). Cultural capital: knowledge, tastes and credentials that signal and bring advantage (Bourdieu). Gini coefficient: a number from 0 (perfect equality) to 1 (one person has everything) summarizing inequality. Intergenerational mobility: change in position between parents and their children.
Three theories of class
Karl Marx (1818-1883) defined class by relationship to the means of production. In industrial capitalism the bourgeoisie own factories and capital; the proletariat sell their labor to live. Their interests conflict, since profit comes from the surplus value workers create, and Marx expected this conflict to drive social change. Later Marxists added middle classes, managers and a "precariat" of insecure workers.
Max Weber (1864-1920) said class matters but is not the whole story. He separated three dimensions: class (market position and life chances), status (social honor, such as prestige of an occupation), and party (organized power in politics). A drug dealer can be rich but low in status; a professor may have status and modest income. Weber's view is the root of most modern "socioeconomic status" measures, which combine income, education and occupation.
Pierre Bourdieu (Distinction, 1979) showed that advantage has more than one currency: economic capital (money and property), cultural capital (tastes, accent, degrees, how comfortable you feel in elite settings) and social capital (networks and contacts). People convert one form into another, and cultural capital often passes silently from parents to children, which helps explain why classes reproduce themselves.
Measuring inequality: the Lorenz curve and the Gini
Line the households up from poorest to richest. For each share of households, plot the share of total income they hold. This is the Lorenz curve (Max Lorenz, 1905). If incomes were identical, the points would fall on the 45-degree diagonal. The more the curve sags below, the more unequal the distribution.
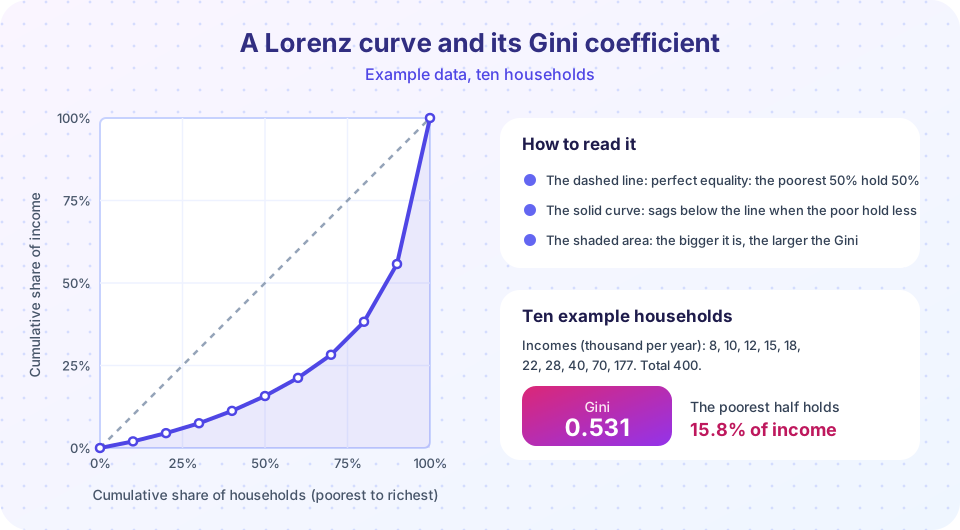
The Gini coefficient (Corrado Gini, 1912) equals the area between the diagonal and the curve divided by the whole triangle under the diagonal, so it runs from 0 to 1. For a sorted list of n incomes x1 <= x2 <= ... <= xn:
G = 2 * (1*x1 + 2*x2 + ... + n*xn) / (n * (x1 + ... + xn)) - (n + 1) / n
Worked example
Ten households earn 8, 10, 12, 15, 18, 22, 28, 40, 70 and 177 (thousand per year), a total of 400. The poorest five households together earn 63, which is 15.8% of the total. The richest one household earns 44.3%. The formula gives a Gini of about 0.53.
Press Run (or Ctrl + Enter) to see the result here.
Program input · what you'd type while the program runs
Type the answers before you press Run, one per line. Each time the program reads a line (with input()), it gets the next line from this box.
The Gini is useful but blunt. Two very different distributions can have the same Gini, and it says nothing about where in the distribution the gap lies. That is why analysts also report the share of income held by the top 10% or 1%, or the ratio of the 90th to the 10th percentile. Those are in the inequality-measurement project.
Social mobility
Social mobility is movement up or down the class structure. Sociologists distinguish:
- Intergenerational mobility: children compared with their parents. Intragenerational: one person's own career over time.
- Absolute mobility: whether people end up better off than their parents (often because the economy grew). Relative mobility: whether people from different backgrounds have the same chance of reaching a given rank. Rapid growth can raise absolute mobility without changing relative mobility.
Large datasets are now available. Raj Chetty and colleagues (2017) estimated that about 90% of US children born in 1940 earned more than their parents, falling to about 50% for those born in the 1980s, mostly because growth was less widely shared. In 2014 the same team estimated that a child born in the bottom fifth of the US income distribution had a chance of roughly 7.5% of reaching the top fifth, with Denmark and Canada showing higher chances. Across countries, Miles Corak has shown that more unequal societies tend to have lower mobility, a pattern nicknamed the "Great Gatsby curve" (Alan Krueger's term). These are statistical associations with debated causes.
Press Run (or Ctrl + Enter) to see the result here.
Program input · what you'd type while the program runs
Type the answers before you press Run, one per line. Each time the program reads a line (with input()), it gets the next line from this box.
The model is a teaching device with an invented link strength. Real estimates come from tax or survey records and vary across places and cohorts.
Common misconceptions
"A high Gini means a poor country." The Gini measures inequality of a distribution, not its level. A very poor and a very rich country can have the same Gini.
"Mobility proves that the system is fair." Some people do move up. The sociological question is how the odds compare across starting points.
"Class is only about income." Weber and Bourdieu both show that status, networks and culture count.
Check your understanding
Quick check · 6 questions
of 6 answered You scored / 6 · perfect!
-
1. According to Marx, class is determined by
Owners (bourgeoisie) and workers (proletariat) differ by ownership of productive property. -
2. Weber's three dimensions of stratification are
Economic position, honor and political organization. -
3. On a Lorenz curve, a curve far below the diagonal means
The poorer groups hold a smaller share than their population share. -
4. A Gini coefficient of 0 means
0 = perfect equality; 1 = one person holds everything. -
5. Which pair is correct?
Growth can lift absolute mobility without changing relative chances. -
6. Bourdieu's concept of cultural capital includes
Cultural capital is non-monetary advantage that can be converted into other forms.
Summary
- Marx stressed ownership; Weber added status and party; Bourdieu added cultural and social capital.
- The Lorenz curve shows how far a distribution departs from equality; the Gini condenses it to one number.
- Mobility can be absolute or relative, between or within generations.
- Studies find less mobility where inequality is high, though causes are debated.
Track your progress
Create a free account to tick off lessons and pick up where you left off on any device.
of Sociology lessons completed