


















Lesson 24 of 46 · Deviance and Social Control
Crime Statistics and the Dark Figure
How is crime counted? Compare police records, victimization surveys and self-reports, learn the dark figure of crime, and test how reporting changes create fake crime waves.
News stories often say "crime is up 12%" or "down by a third." What do those numbers actually count? Sociologists have studied this question for a century, because the answer shapes laws, police budgets and public fear. The key lesson is that every crime statistic is the result of a chain of human decisions: someone must notice an event, decide it is a crime, report it, and have an official record it. Where the chain breaks, crime disappears from the numbers.
What you will learn
- Compare police records, victimization surveys and self-report surveys.
- Define the dark figure of crime and name what widens it.
- Explain how changes in reporting or recording can create apparent crime waves.
- Read a crime statistic critically.
Key terms
Dark figure of crime: crime that happens but never appears in official statistics. Police-recorded crime: offenses reported to or discovered by police and entered in official records. Victimization survey: a survey that asks a sample of people whether they were victims, whether or not they told the police. Self-report survey: a survey in which people say whether they have committed offenses.
Three ways to count crime
| Source | What it counts | Strengths | Weaknesses |
|---|---|---|---|
| Police records (for example the FBI's Uniform Crime Reports in the United States, since the 1930s) | Offenses known to the police | Large, regular, local detail | Misses unreported crime; affected by police practice |
| Victimization surveys (the US National Crime Victimization Survey since 1973; the Crime Survey for England and Wales, begun in 1982) | Experiences reported by a random sample of households | Includes unreported crime; stable method | Memory errors; cannot measure crimes without a victim to interview; excludes homicide |
| Self-report surveys (for example school-based surveys of young people) | Offenses people admit to | Reveals offending by people never caught | Honesty, memory, who agrees to answer |
No source is "the truth." Each is a different lens, and sociologists compare them to see what each misses. Homicide is generally treated as the best-counted offense, because dead bodies are hard to hide and most are investigated, although definitions and recording still differ between countries.
What widens the dark figure
- Victims do not report. People may think the matter is too minor, believe the police can do nothing, fear retaliation, feel shame (for example in sexual violence or domestic abuse), or mistrust the police.
- Nobody knows. Fraud, pollution or theft from a workplace can go unnoticed. Crimes without a clear victim, such as drug sales, appear mainly when police go looking.
- Police discretion. Officers decide whether to record an incident, how to classify it and whether to arrest. Pressure to hit targets can change recording.
- Definitions change. If a new law makes stalking or coercive control a crime, recorded crime can rise on the day the law starts, with no change in behavior.
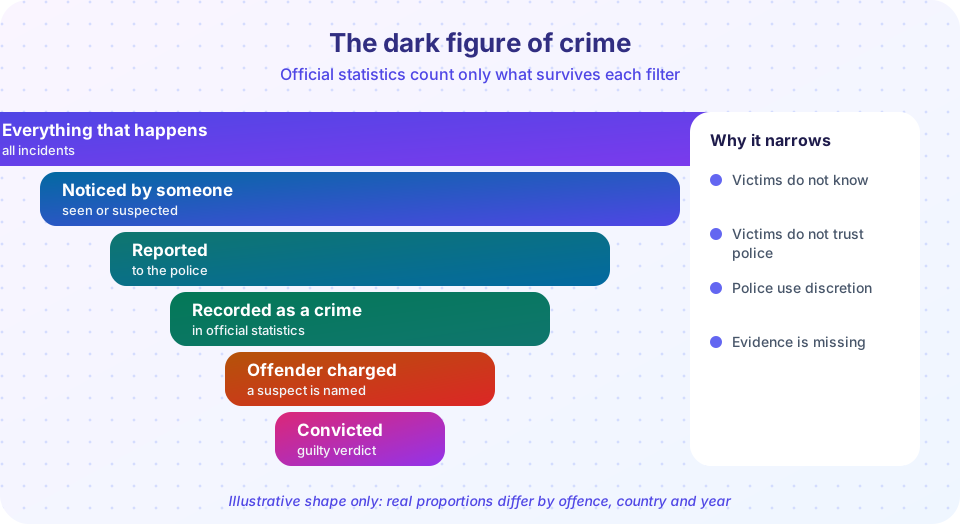
The funnel picture above sums it up: more incidents occur than are noticed, more are noticed than are reported, and only a fraction of recorded offenses lead to a conviction. The shape shows the logic. Do not read numbers off the picture, since real proportions vary widely by type of offense and place.
Why a rise in numbers is not always a rise in crime
Suppose a new campaign encourages victims to come forward. Reports rise, recorded crime rises, and headlines announce a "crime wave." Yet the true rate may be flat, or even falling. The reverse can happen too: if people lose trust in the police, reporting falls and the statistics look better than reality.
Careful analysts therefore:
- compare police records with a victimization survey for the same place and time;
- check whether definitions, recording rules or reporting habits changed;
- look at rates (per 100,000 people), not raw counts, because populations grow;
- remember that homicide trends are the most reliable guide for long-run violence.
Press Run (or Ctrl + Enter) to see the result here.
Program input · what you'd type while the program runs
Type the answers before you press Run, one per line. Each time the program reads a line (with input()), it gets the next line from this box.
Press Run (or Ctrl + Enter) to see the result here.
Program input · what you'd type while the program runs
Type the answers before you press Run, one per line. Each time the program reads a line (with input()), it gets the next line from this box.
Both programs are demonstrations with invented numbers. They show how the arithmetic of reporting works, not any real country's crime.
Reading a crime statistic critically
Ask these questions each time:
- What exactly was counted? Offenses known to police, victim reports or arrests?
- What changed? Laws, recording rules, police priorities, victim willingness to report?
- Is it a rate or a count? And what is the denominator?
- Who is missing? Children, undocumented people, victims who fear police, crimes without victims.
- Does a second source agree? A survey and police data moving together is stronger evidence.
Common misconceptions
"Official statistics measure crime." They measure what the criminal justice system has recorded. Some sociologists call this "the social construction of crime statistics."
"Surveys are always more accurate." They fix some problems but have their own: memory, sampling and the inability to ask about murder victims.
Check your understanding
Quick check · 5 questions
of 5 answered You scored / 5 · perfect!
-
1. The dark figure of crime refers to
It is the gap between all crime and recorded crime. -
2. Which source asks a random sample of people about being victims, whether or not they reported it?
Victimization surveys such as the NCVS and CSEW go to households, not to the police. -
3. A new law defines stalking as a crime. In the year after it begins, recorded stalking rises sharply. The best explanation is that
Before the law the same behavior would not have been recorded as that crime. -
4. Why are rates per 100,000 better than raw counts?
A larger population produces more incidents even when the risk per person is unchanged. -
5. Which offense is usually treated as the best-measured?
Bodies are hard to hide and most killings are investigated, though definitions still vary.
Summary
- Crime statistics come from police records, victimization surveys and self-reports; each has blind spots.
- The dark figure is crime that never reaches the statistics, widened by non-reporting, discretion and unseen offenses.
- Changes in law, recording or reporting can create or hide apparent trends.
- Always ask what was counted, what changed, and whether a second source agrees.
Next: Chapter 5 review
Track your progress
Create a free account to tick off lessons and pick up where you left off on any device.
of Sociology lessons completed