


















Lesson 41 of 46 · Projects and Practice
Project: Design and Analyze a Survey
A hands-on project: write good questions, draw a random sample, compute percentages with margins of error, compare groups with a cross-tab and chi-square test, and report honestly.
In this project you play the sociologist. You will design a short survey, simulate drawing a sample, compute results with margins of error, compare groups, and write an honest summary. The data are simulated with invented numbers, so you can see exactly how the machinery works, and then apply the same steps to a real survey of your own (with permission and ethical care).
What you will learn
- Write clear, unbiased survey questions.
- Draw a random sample and compute percentages with confidence intervals.
- Compare groups with a cross-tabulation, chi-square test and effect size.
- Report results with limits and caveats.
Key terms
Confidence interval: a range that would capture the true population value in about 95% of repeated random samples. Cross-tabulation: a table of counts for two categorical variables. Chi-square test: a test of whether two categorical variables are associated. Cramér's V: an effect size from 0 (no association) to 1 (perfect association).
Step 1: Write good questions
Question wording changes answers. Good practice:
- Be specific. Ask "How many hours did you spend studying last week?" rather than "Do you study a lot?"
- Avoid double-barreled questions. "Do you think schools and hospitals need more funding?" mixes two issues.
- Avoid loaded wording. "Do you agree that wasteful government spending should be cut?" pushes the answer.
- Offer balanced, complete options (including "don't know" where appropriate) and an order that does not nudge.
- Pilot test with a handful of people to find confusing items.
Rewrite this: "Don't you agree that our excellent school should obviously keep its long, helpful homework policy?" A neutral version: "How do you feel about the amount of homework set at your school? (Too little, About right, Too much)."
Step 2: Draw a random sample
In a real survey you need a list of the population (a sampling frame) and a way to pick people randomly. Then think about non-response: people who refuse may differ from those who reply, so surveys often weight results to match known population features. You will sample from a simulated population of 100,000 people.
Step 3: Estimate and report uncertainty
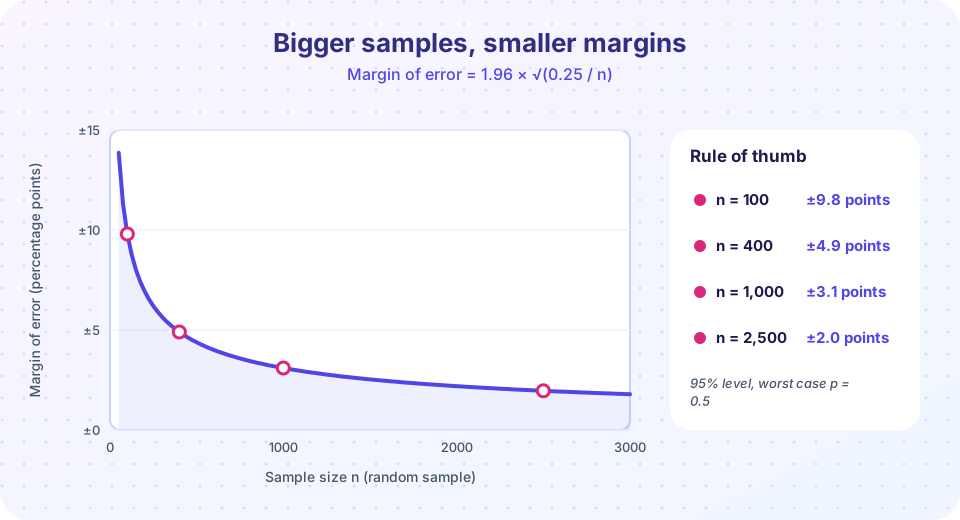
For a proportion p from a random sample of size n, the approximate 95% confidence interval is p ± 1.96 * sqrt(p * (1 - p) / n). Subgroups have smaller n, so wider intervals.
Press Run (or Ctrl + Enter) to see the result here.
Program input · what you'd type while the program runs
Type the answers before you press Run, one per line. Each time the program reads a line (with input()), it gets the next line from this box.
Step 4: Compare groups
A cross-tabulation shows how two variables relate. Report column or row percentages so groups of different sizes can be compared. The chi-square test asks whether the differences are larger than chance would produce; Cramér's V says how strong the association is. A "statistically significant" result in a large sample can still be a tiny effect, so always report both.
Press Run (or Ctrl + Enter) to see the result here.
Program input · what you'd type while the program runs
Type the answers before you press Run, one per line. Each time the program reads a line (with input()), it gets the next line from this box.
Step 5: Write the report
Use this structure:
- Question and hypothesis. What did you want to know?
- Method. Population, sampling frame, sample size, date, question wording, response rate.
- Results. Percentages with margins of error; a cross-tab.
- Limits. Non-response, wording effects, self-report bias, correlations that need explanation.
- Conclusion. Only what the evidence supports. Avoid causal claims from a single cross-section.
An honest sentence, using the numbers from the runs above: "In a simulated random sample of 800 people, 53% agreed (plus or minus 3.5 points), with agreement higher among older groups (45% of the youngest versus 61% of the oldest). The difference is statistically detectable (chi-square p = 0.002) but small (Cramér's V = 0.13), and the survey cannot tell whether age itself or something that goes with age explains it." Replace the numbers with your own when you change the code.
Your own mini project (optional)
- Choose a topic that is safe and not sensitive (for example, study habits or transport to school).
- Write 6 to 8 questions, pilot them with 3 people, and revise.
- Ask a teacher or parent about permission rules. Tell respondents the purpose, make participation voluntary and keep answers anonymous.
- Aim for a sample that is as varied as you can make it, and describe honestly how you chose people (a classroom or friend group is a convenience sample and cannot represent everyone).
Common misconceptions
"p < 0.05 means the finding is important." It means it would be unusual under chance alone. Effect size and design matter.
"The margin of error covers all errors." It covers random sampling error only, not bias, wording effects or non-response.
Check your understanding
Quick check · 4 questions
of 4 answered You scored / 4 · perfect!
-
1. Which question is double-barreled?
It asks about two things at once. -
2. Compared with the whole sample, a subgroup's margin of error is usually
Smaller n means larger sampling error. -
3. Cramér's V measures
It ranges from 0 to 1. -
4. A convenience sample of your friends can support
It is not a probability sample.
Summary
- Good surveys use clear, neutral, single-topic questions and pilot testing.
- Random samples give percentages with margins of error; subgroups have wider intervals.
- Cross-tabs, chi-square tests and effect sizes describe differences between groups.
- Report methods, limits and cautious conclusions.
Track your progress
Create a free account to tick off lessons and pick up where you left off on any device.
of Sociology lessons completed