


















Lesson 42 of 46 · Projects and Practice
Project: Measuring Inequality
A hands-on project: compute Lorenz curves, Gini, top shares, percentile ratios and the Palma ratio, then test how a tax and equal payout or a progressive tax changes each measure.
Chapter 6 introduced the Lorenz curve and the Gini coefficient. In this project you will build a small toolkit of inequality measures, apply it to example data, and test how a policy changes the picture. Along the way you will see why a single number is never enough, and how to write a careful sentence about inequality.
What you will learn
- Compute the Gini, top-10% share, 90/10 ratio and Palma ratio.
- Predict and test the effect of a flat tax with an equal payout.
- Compare a flat and a progressive scheme.
- Describe results in plain, careful language.
Key terms
Top 10% share: the share of total income held by the richest tenth. P90/P10 ratio: income at the 90th percentile divided by income at the 10th. Palma ratio: income share of the top 10% divided by the share of the bottom 40%. Redistribution: moving income through taxes and transfers.
A toolkit of measures
| Measure | What it captures | Blind spot |
|---|---|---|
| Gini coefficient | Overall departure from equality | Different shapes can give the same Gini |
| Top 10% (or 1%) share | How much the top holds | Says nothing about the bottom |
| P90/P10 | Distance between the high and low ends | Ignores both tails and the middle |
| Palma ratio | Top 10% versus bottom 40% | Ignores the middle half |
Ranking countries or years by different measures can give different orders. That is not a bug: each measure asks a different question.
Experiment 1: a flat tax with an equal payout
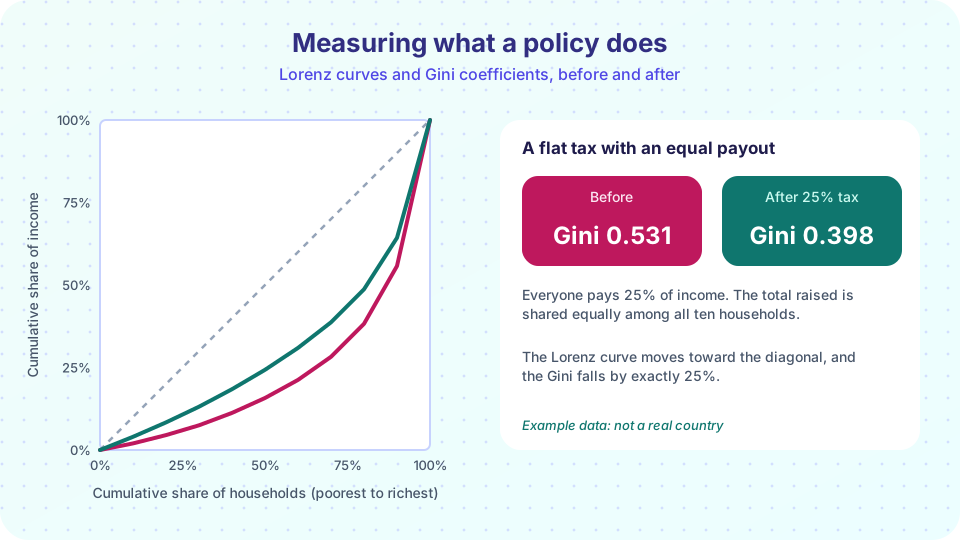
Suppose everyone pays a share t of income, and the total collected is divided equally. Each person ends with income * (1 - t) + t * mean_income. The Lorenz curve moves toward equality. A neat fact follows: the Gini falls by exactly the factor (1 - t), so a 25% tax cuts the Gini by 25%. (The reason: after the payout, each person's gap from the mean shrinks by 1 - t.)
Press Run (or Ctrl + Enter) to see the result here.
Program input · what you'd type while the program runs
Type the answers before you press Run, one per line. Each time the program reads a line (with input()), it gets the next line from this box.
Experiment 2: a bigger population and several measures
Real analyses use thousands of observations. Here you generate a skewed (lognormal) population, which resembles real income shape, compute all four measures, and compare a flat scheme with a progressive scheme that takes a low share of income up to the median and a much higher share above it.
Press Run (or Ctrl + Enter) to see the result here.
Program input · what you'd type while the program runs
Type the answers before you press Run, one per line. Each time the program reads a line (with input()), it gets the next line from this box.
The progressive scheme collects a little more (about 23% of total income, against 20% for the flat one), so a fair comparison should match revenue. Set flat = 0.227 and rerun: the progressive scheme still gives the lower Gini, because it takes proportionally more from those who have more.
Both experiments use invented data and simplified policies. Real tax-and-transfer systems also change behavior (work, saving, avoidance), have administrative costs, and deliver benefits in services as well as cash. Analysts compare market income with disposable income to see what the system does.
Write it up
A good sentence has three parts: the measure, the comparison and the limit. Example: "In the example, the Gini coefficient of 0.53 falls to 0.40 after a flat 25% tax with an equal payout; the top household's share of income falls, and the curve moves closer to the line of equality. This is a simplified model with no behavioral response."
Checklist for your own project:
- Say which income concept you used (market, disposable, per person or per household).
- Report at least two measures.
- Describe the shape (who is above and below), not only a single number.
- Mention what the data leave out (wealth, services, informal income).
Common misconceptions
"A lower Gini always means a better society." It measures one feature of a distribution. A society could lower inequality by making everyone poorer. Judging "better" also needs levels, security and fairness.
"Redistribution has no side effects." Real policies can change incentives; the size of such effects is debated and depends on design.
Check your understanding
Quick check · 4 questions
of 4 answered You scored / 4 · perfect!
-
1. A flat tax with an equal payout changes the Gini by the factor
Each person's distance from the mean shrinks by 1 - t. -
2. The Palma ratio compares
It ignores the middle half. -
3. Which statement about the Gini is correct?
That is why analysts report several measures. -
4. P90/P10 equals
It describes the distance between high and low incomes.
Summary
- Gini, top shares, percentile ratios and the Palma ratio each answer a different question about inequality.
- A flat tax with an equal payout lowers the Gini by the tax rate; progressive schemes can reduce it more.
- Models are simplified: real policies change behavior and include services, not only cash.
- Report the measure, the comparison and the limits.
Next: Practice set
Track your progress
Create a free account to tick off lessons and pick up where you left off on any device.
of Sociology lessons completed