


















Lesson 12 of 46 · Smith Chart and Matching
Smith Chart Basics: Reading Impedance and Reflection
Learn how the Smith chart is built from the reflection coefficient, how to read resistance and reactance circles, VSWR circles and the admittance chart, with a live chart.
The Smith chart looks complicated: a thicket of circles and arcs. It is actually a very simple object. It is the plane of reflection coefficients with two families of curves drawn on it: curves where the resistance is constant and curves where the reactance is constant. Once you know where the curves come from you can read any point, and you can predict how it moves when you add components or lengths of line.
What you will learn
- How to normalize an impedance and convert it to a point on the chart.
- Where the constant-
rcircles and constant-xarcs come from. - How to read
Γ(magnitude and angle), VSWR and return loss from a point. - How to rotate a point along a line and how to get the admittance.
Key terms
- Normalized impedance (z):
z = Z / Z0 = r + jx. - Constant-r circle: all points with the same normalized resistance.
- Constant-x arc: all points with the same normalized reactance.
- VSWR circle: a circle centered on the chart center; every point on it has the same
|Γ|and VSWR. - Admittance chart: the same chart read with normalized admittance
y = 1/z = g + jb.
From impedance to a point
Pick the reference impedance (almost always Z0 = 50 Ω) and normalize: a load of 25 + j25 Ω becomes z = 0.5 + j0.5. The reflection coefficient is
Γ = (z − 1) / (z + 1)
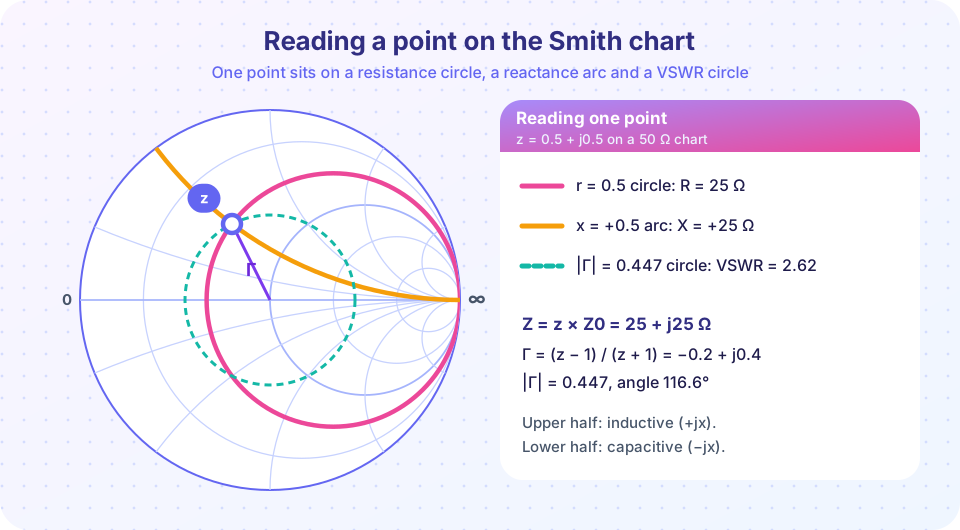
For z = 0.5 + j0.5: Γ = (−0.5 + j0.5)/(1.5 + j0.5) = −0.2 + j0.4, which has magnitude 0.447 and angle 116.6°. That is the coordinate of the point. The chart's rings tell you r and x so you can go the other way: find the point where the right resistance circle and reactance arc cross.
Where the circles come from
Solve Γ = (z − 1)/(z + 1) for constant r and you find circles. Take z = r + jx and let x vary:
- Constant-r circles have centers at
(r/(1 + r), 0)and radius1/(1 + r). They all touch the right edge of the chart (the open-circuit pointΓ = 1). Ther = 0circle is the outer rim, ther = 1circle passes through the center, andr → ∞shrinks to the right-hand point. - Constant-x arcs are pieces of circles with centers at
(1, 1/x)and radius1/|x|. Positivexarcs curl up, negativexarcs curl down, and they all pass throughΓ = 1. Thex = 0line is the horizontal real axis.
You do not need to memorize these. You need to know the shapes: resistance circles are nested like bubbles on the right edge; reactance arcs fan out from the right edge.
Reading a point: a worked example
Take z = 0.5 + j0.5 (Z = 25 + j25 Ω, from the picture).
- Resistance and reactance. The point lies on the circle
r = 0.5and the arcx = +0.5. - |Γ| and angle. Measure from the center:
|Γ| = 0.447, angle116.6°(second quadrant). - VSWR. Draw the circle through the point centered on the chart center. Where it crosses the right half of the real axis you read
r = VSWR; herer = 2.62. Check:(1 + 0.447)/(1 − 0.447) = 2.62. - Return loss.
−20 log₁₀ 0.447 = 6.99 dB.
On a printed chart, the scale at the bottom reads |Γ|, return loss and VSWR directly. In software the numbers are shown beside the cursor.
Moving along a line
On a lossless line |Γ| stays constant, so the point slides clockwise around its VSWR circle when you move toward the generator (away from the load), through 2βd radians for a distance d. A full revolution is d = λ/2; a quarter wavelength is half a revolution (180°), which sends z to 1/z.
Worked example. Move the point z = 0.5 + j0.5 by 0.1 λ toward the generator. The angle of Γ decreases by 4π × 0.1 rad = 72°: 116.6° → 44.6°. At the new angle Γ = 0.3185 + j0.3137, which gives z = (1 + Γ)/(1 − Γ) = 1.42 + j1.12, or Z = 71 + j56 Ω. You can check this with the line formula of chapter 2 (βl = 36°): the same result.
Moving toward the load rotates counter-clockwise.
Impedance versus admittance
Many matching steps involve parts in parallel, which add as admittances. The chart handles this with a simple trick: the admittance y = 1/z of a point sits exactly opposite it (rotated 180° about the center), since a quarter wavelength inverts the impedance. So:
- To read admittance, rotate the point 180° and read it on the same circles; or
- Use an admittance chart, which is the same grid rotated by 180° (the circles become
gandbcircles).
Shunt parts move a point along constant-conductance circles and series parts along constant-resistance circles. A shunt capacitor adds +jb (clockwise), a series capacitor adds −jx (counter-clockwise), so the two move the point in opposite senses.
| Add a... | Moves along | Direction |
|---|---|---|
| series L | constant-r circle |
clockwise |
| series C | constant-r circle |
counter-clockwise |
| shunt C | constant-g circle |
clockwise |
| shunt L | constant-g circle |
counter-clockwise |
| line toward generator | |Γ| circle |
CW |
Common misconceptions
- "The chart only works for 50 Ω." The chart is normalized. Any
Z0works; you only divide by it. A 75 Ω system uses the same chart. - "VSWR is read at the right edge." The right edge is the open circuit. VSWR is read where the VSWR circle crosses the real axis on the right (the high-resistance side).
- "Counter-clockwise means toward the generator." Toward the generator is clockwise. Toward the load is counter-clockwise.
Try it
This is a live Smith chart. Choose a normalized impedance with the first two sliders and a distance along the line with the third. The indigo point is your load, the pink point is the impedance after the line, and the dashed ring is the VSWR circle.
Now the same ideas as code. This script checks the worked example: it normalizes, computes Γ, rotates by 0.1 λ and verifies the result against the line formula from chapter 2.
Press Run (or Ctrl + Enter) to see the result here.
Program input · what you'd type while the program runs
Type the answers before you press Run, one per line. Each time the program reads a line (with input()), it gets the next line from this box.
Check your understanding
Quick check · 6 questions
of 6 answered You scored / 6 · perfect!
-
1. A 100 Ω resistor on a 50 Ω system has the normalized impedance
z = Z/Z0 = 100/50 = 2, on the real axis at the right of the center. -
2. Which circle on the chart passes through the center?
The r = 1 circle passes through z = 1 at the center (Γ = 0). -
3. A point sits on the VSWR circle that crosses the real axis (right side) at r = 3. What is the VSWR?
On the right half of the real axis, r equals the VSWR. -
4. How far toward the generator must you move to go once around the chart?
A phase of 2βd = 2π needs d = λ/2. -
5. What does a quarter-wavelength line do to a point on the chart?
A λ/4 line is a half turn: z → 1/z, the admittance point. -
6. Which statement about the chart is correct?
Positive reactance is inductive and lives in the upper half; toward the generator is clockwise.
Summary
- Normalize
z = Z/Z0and plotΓ = (z − 1)/(z + 1). - Constant-
rcircles touch the right edge; constant-xarcs fan out from it. - VSWR is the value of
rwhere the VSWR circle crosses the real axis on the right. - Toward the generator is clockwise; one turn is
λ/2;λ/4gives the admittance point. - Shunt parts move along constant-conductance circles; series parts along constant-resistance circles.
Next: Lumped-Element Matching
Track your progress
Create a free account to tick off lessons and pick up where you left off on any device.
of RF Engineering and Antennas lessons completed