


















Lesson 40 of 45 · Projects and Practice
Project: a reaction-time experiment
Design, run and analyze a simple reaction-time experiment: warning cue versus no cue, repeated trials, mean and spread, a permutation test and a cautious conclusion.
Psychology becomes real when you collect data. Reaction time, the time between a signal and your response, is one of the oldest measures in the field. Franciscus Donders used it in the 1860s to estimate how long mental steps take, and it is still used to study attention, memory and aging.
In this project you will build a small experiment, run it on yourself (or friends, with their permission), and analyze the numbers like a researcher: with repeated trials, a comparison between conditions, a measure of spread and a cautious conclusion.
What you will learn
- How to turn a question into a testable hypothesis with a measurable outcome.
- Why repeated trials and random order matter.
- How to summarize reaction times with a mean, median and spread.
- How to run a permutation test to ask whether a difference could be due to chance.
- How to state a conclusion that stays within the evidence.
Key terms
Independent variable: the thing you change on purpose (here: cue or no cue).
Dependent variable: the thing you measure (here: reaction time in milliseconds).
Control: keeping everything else equal so the difference is due to your manipulation.
Counterbalancing: varying the order of conditions so order effects do not bias results.
Effect size: how big a difference is, not just whether it exists.
Step 1: the question and hypothesis
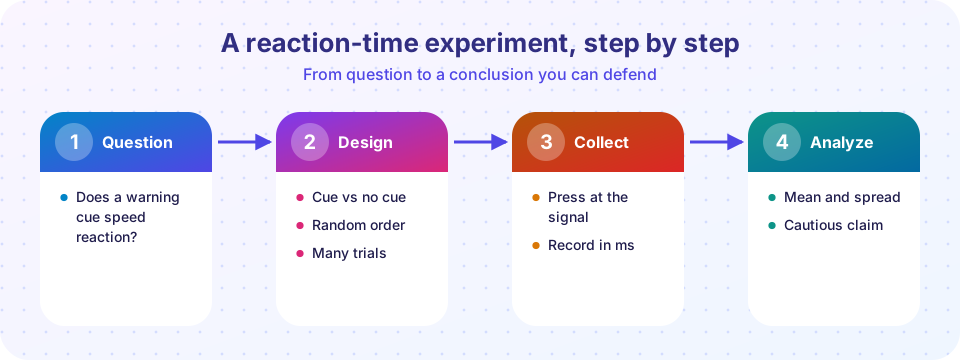
Question: Does a warning cue make people react faster? A hypothesis is a specific, testable prediction: "Reaction times will be shorter, on average, when a warning beep comes 1 second before the signal than when no warning is given." A good hypothesis says which way the difference should go and what is measured.
Pre-state your plan before collecting data (this is the core idea of preregistration). It prevents the temptation to hunt through results for something that looks significant.
Step 2: design
- Within-subject design: the same person does both conditions. This removes differences between people, but order can matter (practice, fatigue). Fix it by counterbalancing: some sessions start with cue, others start without.
- Many trials: reaction times vary a lot from trial to trial. Use at least 20 per condition.
- Random delays: if the signal always appears after exactly 2 seconds, you can predict it and your measurement is no longer about reaction. Use random waits.
- Fixed setup: same device, same screen, same hand, no distractions.
- Ethics: volunteers should know what they are doing, may stop at any time, and their data should be anonymous. Use simple tasks without risk.
Step 3: collect
The demo below presents a signal after a random delay and measures your response time with the browser's high-resolution timer. Real experiments need more careful timing (screens and keyboards add delays of tens of milliseconds), so treat the numbers as rough. Press the button as soon as the box turns green. Pressing early counts as an error and is not recorded.
Collect at least 20 trials in each condition, switching the condition in a counterbalanced order. Copy your lists into the analysis below.
Step 4: analyze
Reaction times are skewed: a few very slow trials (a blink, a distraction) pull the mean upward. So report both the mean and the median, and look at the spread (standard deviation). The analysis below uses invented practice data, so you can test the code before using your own numbers. A permutation test asks: if the labels "cue" and "no cue" were meaningless, how often would shuffling them produce a difference at least this large?
Press Run (or Ctrl + Enter) to see the result here.
Program input · what you'd type while the program runs
Type the answers before you press Run, one per line. Each time the program reads a line (with input()), it gets the next line from this box.
Step 5: a cautious conclusion
A good conclusion has four parts.
- What you found: "In my practice data, reactions were about 30 ms faster with the cue, and shuffling labels rarely produced a difference that large."
- How sure you are: a small sample from one person on one device is weak evidence. A low share in the permutation test says "unlikely to be pure chance in this data," not "proved."
- Alternative explanations: practice effects, fatigue, device delay, whether the cue was predictable.
- Next step: more trials, more participants, counterbalancing, a better timing device.
For a deeper treatment of designs, statistics and ethics, see research methods in psychology and statistics and probability.
Common misconceptions
"A small p-value or rare shuffle means a big effect." It says nothing about size. Always report the difference in milliseconds too.
"One person's data show how everyone behaves." Individual differences are large; generalizing needs many participants.
"Removing slow trials to get a cleaner result is fine." Only remove outliers by a rule you set before looking, and report that you did.
Check your understanding
Quick check · 5 questions
of 5 answered You scored / 5 · perfect!
-
1. Why use random delays before the signal?
Predictable timing would let people anticipate instead of react. -
2. What is counterbalancing?
It prevents order effects such as practice or fatigue from favoring one condition. -
3. Why report the median as well as the mean for reaction times?
Reaction-time data are right-skewed, so the median is more robust. -
4. What does a permutation test estimate?
Shuffling labels builds a distribution of differences under 'no effect'. -
5. Which conclusion is appropriately cautious?
Cautious conclusions state the result, its limits and the next steps.
Summary
- A good experiment has a testable hypothesis, a clear independent and dependent variable, and controls.
- Use many trials, random delays and counterbalanced order.
- Summarize with mean, median and spread; use a permutation test to check chance.
- Report what you found, its limits, alternative explanations and next steps.
Track your progress
Create a free account to tick off lessons and pick up where you left off on any device.
of Introduction to Psychology lessons completed