


















Lesson 8 of 45 · The Science of Psychology
Correlation and Causation
Understand what the correlation coefficient r means, how to read scatterplots, why correlation does not prove causation and how third variables mislead.
Headlines love this phrase: "People who do X are more likely to Y." It sounds like a discovery about causes. Often it is only a correlation: two things that tend to go together. Telling the two apart is among the most important thinking skills this course can give you. It protects you from bad advice, and it makes you better at asking "what else could explain this?"
What you will learn
- What a scatterplot shows and how to read the correlation coefficient r.
- What r can and cannot tell you, including nonlinear patterns.
- The three explanations behind a correlation, plus chance.
- Why experiments are needed to establish cause, and what partial remedies exist.
Key terms
Correlation: a measure of how two variables change together.
Correlation coefficient (r): a number from -1 to +1 giving the direction and strength of a straight-line relationship.
Scatterplot: a graph with one dot per person, positioned by their values on two variables.
Third variable: an unmeasured factor that influences both measured variables and creates a correlation between them.
Spurious correlation: a relationship that is due to chance or a hidden factor, not a direct link.
Reading a scatterplot
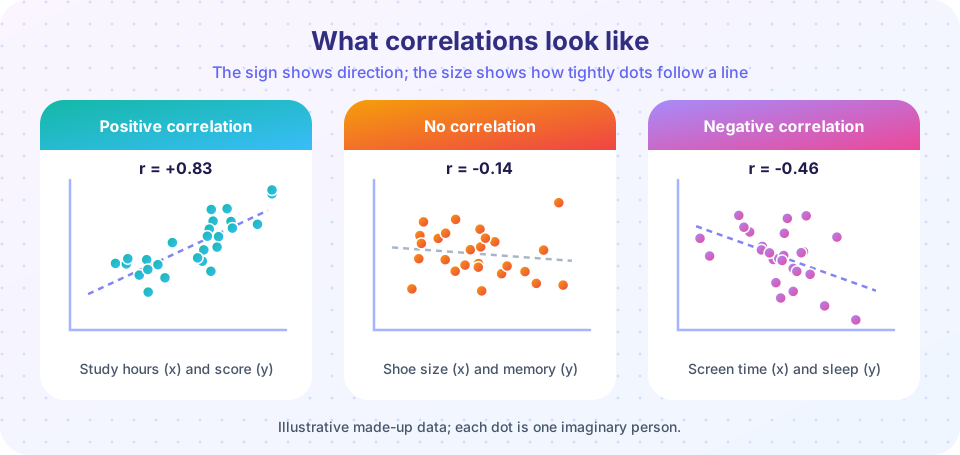
Put one variable on the horizontal axis and the other on the vertical axis. Each person is a dot. If the dots form a cloud sloping upward, the correlation is positive: high values on one variable go with high values on the other (study hours and test scores, say). Sloping downward is negative (more time on a screen late at night, fewer hours of sleep). A shapeless cloud means no correlation.
The coefficient r puts a number on this. It runs from -1 (a perfect downward line) through 0 (no straight-line relationship) to +1 (a perfect upward line). The closer to either end, the more tightly the dots hug a line. A rough guide that psychologists often borrow from Jacob Cohen's conventions: about 0.1 is small, 0.3 is moderate and 0.5 or more is large, but what counts as "large" depends on the field and the stakes.
The square of r, called r², tells you the share of the variation in one variable that is statistically "accounted for" by the other. An r of 0.5 means r² = 0.25, so a quarter of the variation; three-quarters is due to other things. Even a "large" correlation leaves a lot unexplained.
What r cannot tell you
- Direction of cause. r is symmetrical. The correlation between A and B equals that between B and A.
- Curved relationships. r only measures straight-line patterns. Performance and arousal follow an inverted U (too little arousal and too much both hurt, the Yerkes-Dodson law); the correlation across the whole range may be near zero even though the relation is strong.
- Effects of outliers. One extreme point can create or destroy a correlation. Always look at the scatterplot.
- Effects of restricted range. If you only study top students, the link between study time and grades will look weaker than across all students.
Why correlation is not causation
Whenever A and B are correlated, there are at least three causal stories, plus chance.
- A causes B. (Practice improves memory.)
- B causes A. (People with good memory enjoy practicing, so they do more.) This is the reverse causation problem.
- A third variable C causes both. (Motivation drives both practice and memory scores.)
- Chance. In a large set of variables, some pairs will correlate by luck.
Classic example: in summer, ice cream sales and drownings both rise. Nobody thinks ice cream causes drowning. The third variable is hot weather: it makes people buy ice cream and also swim. When you compare only days with the same temperature, the relationship disappears (see the demonstration below).
A real research example is hormone therapy after menopause. Large observational studies of women found that those taking hormones had fewer heart problems. The conclusion looked obvious: hormones protect the heart. But when a randomized controlled trial (the Women's Health Initiative, reported in 2002) assigned women at random, it did not find the protection and found some harms. Women who chose hormones were, on average, healthier and wealthier in many ways, the so-called "healthy user" effect. The correlation was real; the causal story was not.
Language check. Words like "linked to", "associated with" and "predicts" describe a correlation. Words like "causes", "leads to" and "makes" claim cause. Notice which words a headline uses and whether the study design could support them.
How researchers get closer to cause
- Experiments with random assignment (see research methods) are the strongest tool. Random assignment makes sure that third variables are balanced on average.
- Longitudinal designs show which variable changes first, which helps with reverse causation but not with third variables.
- Statistical control measures suspected third variables and removes their influence mathematically. It only handles variables you measured.
- Natural experiments use events that happen to assign people almost at random, such as lottery draws or the date a law took effect.
- Replication and converging evidence from many designs build a strong case.
For ethical reasons some causes can never be tested with experiments: you cannot randomly assign children to abuse or neglect. Researchers then rely on converging evidence, and conclusions must be stated carefully.
Illusory correlations
People also "see" correlations that are not there. Loren and Jean Chapman (1967) showed that observers saw links between certain drawings and symptoms that did not exist in the data, because the pairing seemed to make sense. Memorable pairs (a rare event with a rare group) stand out and are over-counted, a root of stereotypes. Checking real numbers, not impressions, is the cure.
Common misconceptions
"r = 0 means there is no relationship." It means no straight-line relationship. A curve can be strong with r near 0.
"A strong correlation proves cause." However strong, a correlation alone cannot show direction or rule out third variables.
"Correlation is useless." It is extremely useful for prediction (insurance, screening, forecasting), even where we do not know the cause.
"A negative correlation is a weak one." The sign gives direction only; strength is the absolute value. r = -0.8 is stronger than r = +0.3.
Try it
First, a "guess the correlation" game. Each round shows a scatterplot of made-up data. Move the slider to your best guess of r, then check. Most people underestimate strong correlations at first.
Second, use Python to generate data with a chosen correlation and see how r relates to the picture. Change targets to try other values.
Press Run (or Ctrl + Enter) to see the result here.
Program input · what you'd type while the program runs
Type the answers before you press Run, one per line. Each time the program reads a line (with input()), it gets the next line from this box.
Third, a third variable at work. Temperature drives both ice cream sales and swimming (and so drownings) in this made-up model. Ice cream does not cause anything in it. Compare the raw correlation with the correlation after removing temperature's influence from both.
Press Run (or Ctrl + Enter) to see the result here.
Program input · what you'd type while the program runs
Type the answers before you press Run, one per line. Each time the program reads a line (with input()), it gets the next line from this box.
Check your understanding
Quick check · 5 questions
of 5 answered You scored / 5 · perfect!
-
1. Which value of r indicates the strongest relationship?
Strength is the absolute value. The sign gives direction only. -
2. Students who sleep more have higher grades. Which conclusion is NOT justified by this correlation alone?
A correlation allows several explanations (A causes B, B causes A, a third variable), so it cannot establish that sleep definitely causes grades. -
3. A data set shows a strong inverted-U relationship, yet r is about 0. Why?
r captures linear patterns; curved patterns can have near-zero r. -
4. What design best tests whether a tutoring program causes better grades?
Random assignment balances hidden differences like motivation. -
5. If r = 0.5 between two variables, r² = 0.25 means
r² is the proportion of shared variance.
Summary
- r runs from -1 to +1; its sign gives direction and its size gives strength.
- Always look at the scatterplot: curves, outliers and restricted range can fool r.
- A correlation may come from A causing B, B causing A, a third variable or chance.
- Only random-assignment experiments directly test cause; other designs bring partial evidence.
- Read headlines for the verbs: "linked to" is not "causes".
Track your progress
Create a free account to tick off lessons and pick up where you left off on any device.
of Introduction to Psychology lessons completed