


















Lesson 9 of 45 · The Science of Psychology
Measurement, Sampling, Statistics and Ethics
Learn how psychologists measure the mind, why samples and statistics matter, how to read p-values and effect sizes, and the ethical rules that protect participants.
A good design is only the start. To produce trustworthy evidence, researchers also need to measure the right thing consistently, study people who represent the population they care about, use statistics honestly and treat participants with respect. This lesson covers all four. It is dense, so take it in pieces: the vocabulary is the real prize.
What you will learn
- How to turn an idea into a measure, and how reliability and validity are judged.
- Why sampling can make or break a study, and what "WEIRD" means for generalizing.
- How to read mean, median and standard deviation, p-values and effect sizes.
- The ethical principles and historical cases behind today's research rules.
Key terms
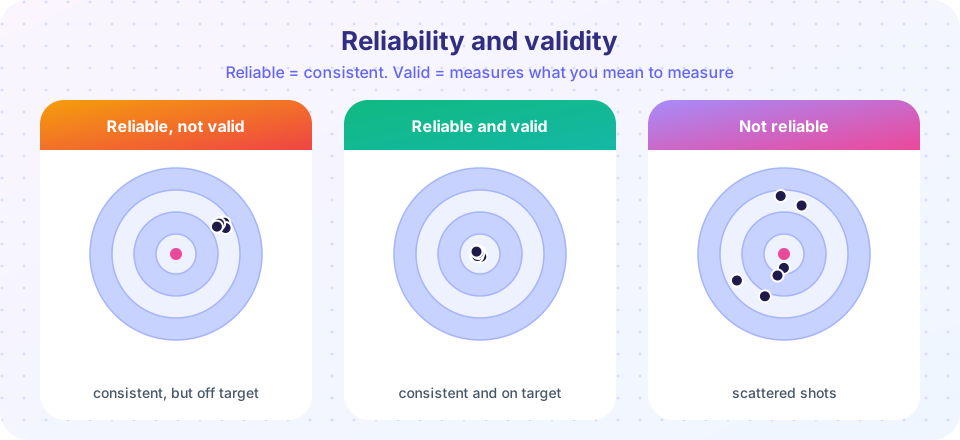
Reliability: the consistency of a measure across time, raters or items.
Validity: the extent to which a measure captures what it is meant to capture.
Sample and population: the sample is the group studied; the population is the larger group it should represent.
p-value: the probability of getting results at least this extreme if there were actually no effect.
Effect size: how big a difference or relationship is, regardless of sample size.
Informed consent: agreement to take part after being told what to expect.
Measurement: from idea to number
Psychologists study ideas that cannot be weighed on a scale: intelligence, anxiety, memory, happiness. To measure them, they write an operational definition, a concrete procedure that gives a number. "Memory" becomes "the number of words from a 20-word list recalled after 10 minutes". "Happiness" might become "the score on a validated five-question life satisfaction scale". Operational definitions are always a simplification, so it matters whether they are good ones.
Measures come in four levels:
| Level | What the numbers mean | Example |
|---|---|---|
| Nominal | Categories only | Eye color, type of therapy |
| Ordinal | Order, but unequal gaps | Race finishing place, ranking of preferences |
| Interval | Equal gaps, no true zero | Temperature in degrees Celsius, many scale scores |
| Ratio | Equal gaps and a true zero | Reaction time in ms, number of errors |
Data can be collected through self-report (questionnaires, interviews), behavioral measures (reaction time, choices) and physiological measures (heart rate, hormone levels, brain activity). Each has weak spots: self-report depends on honesty and insight, behavior can be affected by many factors, and physiology is indirect.
Reliability
A reliable measure gives similar results each time. Forms include test-retest reliability (same people, two occasions), inter-rater reliability (do two observers score alike?) and internal consistency (do the items of one scale agree with each other? A common statistic for this is Cronbach's alpha).
Validity
A valid measure captures the real target. Researchers look at several kinds of evidence. Face validity is whether it looks right. Content validity is whether it covers the whole concept. Criterion validity is whether it predicts a relevant outcome (do aptitude scores predict later performance?). Construct validity is the broadest: does the measure behave as theory says it should, correlating with related measures and not with unrelated ones?
Think of a bathroom scale that always reads 2 kg too heavy. It is perfectly reliable (consistent) but not valid (accurate). Reliability is necessary for validity, but it is not enough.
Sampling
Studies use a sample to learn about a population. If the sample is chosen at random from the population, so that every member has an equal chance, it will tend to represent it, and the more people, the smaller the random error. Roughly, the margin of error of a poll shrinks with the square root of the sample size, which is why polls of about 1,000 people are often accurate to a few percentage points.
But size cannot fix bias. In 1936 the magazine Literary Digest mailed millions of ballots and predicted that Alf Landon would beat Franklin Roosevelt in the US presidential election. Roosevelt won in a landslide. The magazine's lists came from telephone directories and car registrations, which in the Depression over-represented wealthier voters. A much smaller but better-designed poll by George Gallup got it right. A large biased sample is just a large way of being wrong.
Most psychology studies use convenience samples: whoever is easy to recruit, often university students. In 2010 Joseph Henrich, Steven Heine and Ara Norenzayan pointed out that most studies sampled people from Western, Educated, Industrialized, Rich, Democratic ("WEIRD") societies, who are a small and in some ways unusual part of humanity. Some results (basic vision, for example) probably generalize well; others (some judgments about fairness or the self) differ across cultures. When you read a study, ask: who were the participants?
Describing data
Three kinds of "average" summarize a set of numbers: the mean (the sum divided by the number of values), the median (the middle value when sorted) and the mode (the most common). The mean is pulled by extreme values; the median is not. For incomes or reaction times, which have long tails, the median is often more informative.
The standard deviation (SD) describes spread, roughly the typical distance of values from the mean. In a bell-shaped (normal) distribution about 68% of values fall within one SD of the mean and about 95% within two. IQ tests, for instance, are scaled to a mean of 100 and an SD of 15.
Inferential statistics: is it more than chance?
If the control group scores 52 and the treatment group scores 55, is that a real difference or just luck? Inferential statistics answer this. A p-value is the probability of seeing a difference at least this large if the true effect were zero. By convention, p below .05 is called "statistically significant".
Very common mistakes:
- A p-value is not the probability that the hypothesis is true or false.
- "Significant" does not mean important. With a huge sample, a tiny, useless difference can be significant.
- "Not significant" does not mean "no effect". The study may be too small to detect one.
That is why researchers also report an effect size (for two groups, often Cohen's d, the difference in means divided by the SD; about 0.2 is called small, 0.5 medium and 0.8 large by convention) and confidence intervals, which show the plausible range of the true effect.
Statistics can also be misused. Running many analyses and reporting the one that reached p < .05 ("p-hacking"), or publishing only positive results, fills the literature with false alarms. Preregistration (stating the plan and analysis before seeing the data), larger samples and sharing materials are the main safeguards.
Ethics
Rules exist because history shows what happens without them. During World War II, Nazi doctors conducted brutal experiments on prisoners, leading to the Nuremberg Code (1947), which put voluntary consent at the center of research ethics. In the US, the Tuskegee syphilis study (1932 to 1972) followed hundreds of Black men with syphilis without telling them the diagnosis and withheld effective treatment after penicillin became available. Public outrage led to the Belmont Report (1979), with three principles: respect for persons, beneficence (maximize benefits, minimize harm) and justice (fair selection of participants).
In psychology, Stanley Milgram's obedience studies in the early 1960s, in which volunteers believed they were delivering painful shocks, and Philip Zimbardo's 1971 prison simulation raised hard questions about stress, deception and consent. Later analyses have also questioned how the Stanford prison study was run and what it really shows. The Little Albert demonstration (history lesson) would not pass an ethics review today.
Modern rules, set out in professional codes such as the APA's and enforced by ethics committees (institutional review boards), include:
- Informed consent, freely given, with the right to withdraw at any time without penalty.
- Minimizing harm: risks must be small and justified by the benefits; vulnerable groups, such as children, get extra protection.
- Deception only if no alternative exists, if the study is important, and followed by a full debriefing.
- Confidentiality and secure handling of data.
- Animal research under strict rules, often summarized as the "3Rs": replace animals where possible, reduce the numbers and refine procedures to reduce suffering.
- Honest reporting: no fabrication, falsification or plagiarism.
Common misconceptions
"A bigger sample is always better." Only if it represents the population. A biased sample of a million is worse than a random sample of a thousand.
"p < .05 means the result is true (or important)." It means the data would be unusual if there were no effect. Importance depends on effect size and context.
"A reliable test must be valid." A test can consistently measure the wrong thing.
"Ethics rules slow down science for no reason." They protect participants and also protect the quality of science, since willing, informed participants give better data.
Try it
First, a bias demonstration. We invent a population of 100,000 people with daily screen time averaging about 3 hours. A random sample estimates the mean well. An online volunteer sample, in which heavy users are more likely to respond, does not, even when it is huge.
Press Run (or Ctrl + Enter) to see the result here.
Program input · what you'd type while the program runs
Type the answers before you press Run, one per line. Each time the program reads a line (with input()), it gets the next line from this box.
Second, a scale-scoring demonstration. Questionnaires often include reverse-scored items to catch careless answering. Rate each statement, then see how the total is calculated. It is a demonstration of scoring, not a test of anything about you.
Third, see what p-values and effect sizes do. With no real effect, about 5% of experiments still come out "significant". With a real medium effect, small studies miss it much of the time. This simulation runs 2,000 experiments of each kind.
Press Run (or Ctrl + Enter) to see the result here.
Program input · what you'd type while the program runs
Type the answers before you press Run, one per line. Each time the program reads a line (with input()), it gets the next line from this box.
Check your understanding
Quick check · 6 questions
of 6 answered You scored / 6 · perfect!
-
1. A bathroom scale always shows a weight 2 kg too high. Which describes it?
It is consistent (reliable) but systematically inaccurate (not valid). -
2. Why did the Literary Digest poll of 1936 fail despite millions of replies?
The mailing lists over-represented wealthier people, so size did not help. -
3. What does a p-value of .03 mean?
A p-value is about the data under the assumption of no effect, not about the truth of the hypothesis. -
4. Which principle was a direct outcome of the Tuskegee study scandal?
Public outrage led to the Belmont Report in 1979, and later to ethics review boards. -
5. Why report effect sizes in addition to p-values?
Significance depends on sample size, while effect size shows the magnitude. -
6. Which is an example of deception that is acceptable under modern ethics?
Deception must be justified, low-risk and followed by debriefing.
Summary
- Operational definitions turn concepts into measurable procedures; reliability (consistency) and validity (accuracy) judge them.
- A good sample represents the population; a big biased sample is still biased; most studies have been WEIRD.
- Mean, median and SD describe data; p-values test against chance; effect sizes show importance.
- p-hacking and publication bias are countered by preregistration, bigger samples and open data.
- Research ethics rest on consent, minimal harm, confidentiality, debriefing and independent review.
Track your progress
Create a free account to tick off lessons and pick up where you left off on any device.
of Introduction to Psychology lessons completed