


















Lesson 41 of 45 · Projects and Practice
Project: an epidemic model (SIR)
Build and explore the SIR model: simulate an epidemic, see how R0 shapes its peak, test the effect of vaccination and compute the final size of an outbreak.
When an infectious disease spreads through a population, the numbers grow, peak and fall in a characteristic way. In 1927 William Kermack and Anderson McKendrick published a model that captures this in three simple equations, and it is still the starting point for most epidemic models. In this project you will build it, run it, and use it to answer practical questions: how big will the outbreak be, how high is the peak, and what does vaccination do?
The model is a thought experiment, not a forecast for any real outbreak. Real diseases have incubation periods, age groups, networks of contacts and changing behavior. But the simple model teaches the central ideas better than a complex one, and it explains why R₀ and herd immunity matter.
Educational information. This project is a simplified teaching model. It is not a tool for predicting real outbreaks or for medical or public health decisions.
What you will learn
- How the three SIR equations describe infection and recovery
- How R₀ = β/γ controls whether and how fast an epidemic grows
- How to solve the equations numerically and plot the curves
- How vaccination changes the course and why the herd immunity threshold is 1 − 1/R₀
- What the final size of an epidemic means
Key terms
Compartment: a group of people in the same state, such as susceptible or infectious.
β (beta): the transmission rate: contacts per day times the chance that a contact transmits.
γ (gamma): the recovery rate, the inverse of the average infectious period.
Epidemic peak: the time when the number of infectious people is greatest.
Final size: the fraction of the population that has been infected when the epidemic ends.
The model
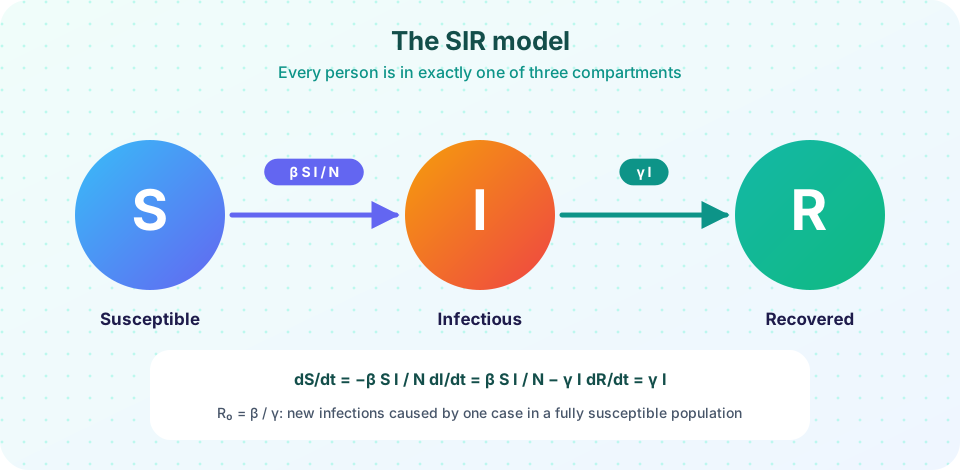
Divide a population of N people into three compartments: S (susceptible, can catch the disease), I (infectious, can pass it on) and R (recovered and immune, or removed). Everyone is in exactly one. The picture above shows the flow. In a small time step:
- Susceptible people become infectious at a rate that depends on how many susceptible people there are, how many infectious people they might meet, and how infectious those encounters are: β × S × I / N.
- Infectious people recover at a rate γ × I. If the average infectious period is 5 days, γ = 1/5 = 0.2 per day.
In equations:
dS/dt = −β S I / N
dI/dt =  β S I / N − γ I
dR/dt =  γ I
The three equations add up to zero, so S + I + R = N always. The key quantity is the basic reproduction number R₀ = β/γ: the number of people one infectious person infects, on average, in a fully susceptible population. If R₀ is above 1, the number of infectious people grows at first, because each case replaces itself with more than one new case. If R₀ is below 1, the disease dies out. The model also shows why the epidemic ends without everyone being infected: as S falls, each case meets fewer susceptible people. The effective reproduction number is R_eff = R₀ × S/N, and the infection peaks when R_eff falls to 1, that is, when S/N = 1/R₀.
Note the assumptions: everyone mixes randomly, there is no delay between infection and becoming infectious, recovered people stay immune, and nobody is born or dies. Each can be relaxed in a more advanced model (for example, adding an E compartment for "exposed" gives the SEIR model).
Step 1: simulate
The first program integrates the equations numerically with scipy and plots the three compartments. Change R0 to see how the epidemic changes.
Step 2: add vaccination
If a fraction v of the population is immune at the start, the initial susceptible number is S₀ = (1 − v) N. When v is greater than the herd immunity threshold 1 − 1/R₀, R_eff is below 1 from the beginning and the outbreak cannot take off. The second program compares the outcomes for different vaccination coverage.
Step 3: final size
The size of the whole epidemic can be found without simulation. If z is the fraction of the population that is ultimately infected (in a population that was fully susceptible), it solves the equation z = 1 − e^(−R₀ z). For R₀ = 2 the answer is about 80 percent, for R₀ = 3 about 94 percent and for R₀ = 1.5 about 58 percent. Even when the epidemic is over, a few percent of the population are left susceptible, because the infection dies out when there are too few infectious people left to find them.
Reading the results
When you run the programs, look at three things. First, the shape: the infectious curve rises, peaks and falls, while the susceptible curve falls and never reaches zero. Second, the timing: a larger R₀ gives a faster, higher and earlier peak, which is why a disease with a high R₀ can overwhelm hospitals in a short time. Third, the effect of immunity: with 30 percent immune at the start, the peak falls to less than half its height, and with 50 percent it is far lower, even though the threshold of 67 percent has not been reached. Partial protection flattens the curve, and full protection stops it.
A useful habit is to check the model against theory. In the first program the susceptible share at the peak is close to 1/R₀, as the mathematics predicts, and the total infected matches the final size equation. If a simulation does not agree with a result that you can derive, you have found a bug or an assumption worth looking at.
Common misconceptions
"The epidemic ends because everyone is immune." It ends because R_eff falls below 1, so each case infects fewer than one other. Some people remain susceptible.
"A peak means the worst is over." The peak is the maximum number of infectious people. In a model, the number of new cases falls after it, but real outbreaks can have waves caused by behavior, new variants or waning immunity.
"R₀ is a fixed property of a germ." It depends on the pathogen and on the population: contact patterns, climate and behavior. The same disease can have a different R₀ in different places.
Try it
First, simulate an SIR epidemic for a town of one million people with an infectious period of 5 days. The model parameters are for illustration.
Press Run (or Ctrl + Enter) to see the result here.
Program input · what you'd type while the program runs
Type the answers before you press Run, one per line. Each time the program reads a line (with input()), it gets the next line from this box.
Second, test vaccination. Each curve starts with a different share of the population immune.
Press Run (or Ctrl + Enter) to see the result here.
Program input · what you'd type while the program runs
Type the answers before you press Run, one per line. Each time the program reads a line (with input()), it gets the next line from this box.
Third, an interactive version in the browser. Move the sliders and watch the curve. The simulation uses a simple small-step method (Euler's method with a step of 0.1 days).
Extensions
- Add an exposed compartment E (infected but not yet infectious) to make an SEIR model, with a rate σ for the incubation period.
- Make β drop on a given day to model a lockdown and see the effect.
- Add births and deaths to see how a disease can become endemic, with a fixed fraction of susceptibles.
- Use the final-size equation with a root finder to check the simulation's total.
Check your understanding
Quick check · 5 questions
of 5 answered You scored / 5 · perfect!
-
1. In the SIR model, what does gamma represent?
If people stay infectious 5 days on average, gamma = 1/5 per day. -
2. What is R0 in terms of beta and gamma?
R0 = beta / gamma, the number of secondary cases from one case in a fully susceptible population. -
3. When does the number of infectious people peak?
At the peak dI/dt = 0, which means R0 x S/N = 1. -
4. With R0 = 4, what share of the population must be immune to prevent an epidemic?
1 - 1/4 = 0.75. -
5. Why does the epidemic end before everyone has been infected?
The effective reproduction number drops below 1, so the infection fades.
Summary
- The SIR model has three compartments and two rates; R₀ = β/γ decides whether an epidemic can start.
- The infectious peak occurs when the susceptible fraction falls to 1/R₀.
- Vaccination lowers S₀; above the threshold 1 − 1/R₀ there is no epidemic.
- The final size solves z = 1 − e^(−R₀ z); some people always remain uninfected.
- Simple models teach concepts, not forecasts; extensions add incubation, behavior and waning immunity.
Track your progress
Create a free account to tick off lessons and pick up where you left off on any device.
of Microbiology lessons completed