


















Lesson 14 of 45 · Bacterial Structure and Growth
Bacterial Growth and the Growth Curve
Learn how bacteria divide by binary fission, calculate generation time and cell numbers, read the four phases of the growth curve, and see how growth is measured.
In microbiology, growth does not mean a cell getting bigger. It means the number of cells getting larger. A single Escherichia coli cell in a rich nutrient broth at body temperature divides about every 20 minutes. That sounds modest until you do the arithmetic: in ten hours there are thirty doublings, and one cell has become more than a billion. The speed of microbial growth is the reason infections can turn serious within a day, why a forgotten cup of milk spoils, and why a tiny contamination ruins a laboratory culture overnight.
Growth also follows a predictable pattern. Put a few cells into a closed flask of broth and watch them for a day, and you will always see four phases. This lesson explains how a cell divides, how to calculate generation time and population size, why the growth curve has four phases, and how scientists measure growth.
What you will learn
- How binary fission works and why DNA copying can overlap with division.
- How to calculate the number of generations and generation time.
- The four phases of the growth curve and what happens in each.
- Common ways to measure bacterial growth.
Key terms
Binary fission: division of one cell into two genetically identical daughter cells.
Generation (doubling) time: the time needed for a population to double.
Exponential growth: growth in which the population doubles at a constant interval.
Batch culture: a culture in a closed vessel with no addition of nutrients or removal of waste.
Optical density (OD): how much a culture scatters light; a quick measure of turbidity.
Binary fission
A bacterium that is ready to divide goes through a series of steps:
- The cell elongates and builds new membrane and wall.
- DNA replication starts at a specific site on the circular chromosome (oriC) and proceeds in both directions. The two copies are pulled toward opposite ends.
- A ring of the protein FtsZ assembles in the middle of the cell, a relative of the tubulin of eukaryotes.
- The ring recruits the enzymes that build a septum (a new cross-wall of membrane and peptidoglycan), which pinches the cell in two.
- The daughters separate (or stay attached, giving chains and clusters).
For E. coli at 37 °C, copying the whole chromosome takes about 40 minutes, yet in rich medium the cell divides every 20 minutes. It manages this by starting new rounds of replication before the previous one is finished, so a cell is born already carrying partly copied DNA. This detail shows how fast and flexible bacterial genome management is.
The arithmetic of doubling
If a population starts with N₀ cells and passes through n generations, the number of cells is
N = N₀ × 2ⁿ
Take logarithms to solve for n:
n = (log₁₀ N − log₁₀ N₀) / log₁₀ 2 ≈ 3.32 × (log₁₀ N − log₁₀ N₀)
and the generation time is g = t / n, where t is the elapsed time in the exponential phase. The growth rate constant is k = n / t (generations per hour).
Worked example. A culture grows from 5 × 10³ cells/mL to 2 × 10⁷ cells/mL in 4 hours of exponential growth. Then
log₁₀(2 × 10⁷) − log₁₀(5 × 10³) = log₁₀(4,000) ≈ 3.60n ≈ 3.32 × 3.60 ≈ 12.0generationsg = 240 min / 12.0 = 20 min
Another example, forward: starting from 1,000 cells with a 30-minute generation time, how many cells after 3 hours? n = 180 / 30 = 6, so N = 1,000 × 2⁶ = 64,000.
The four phases
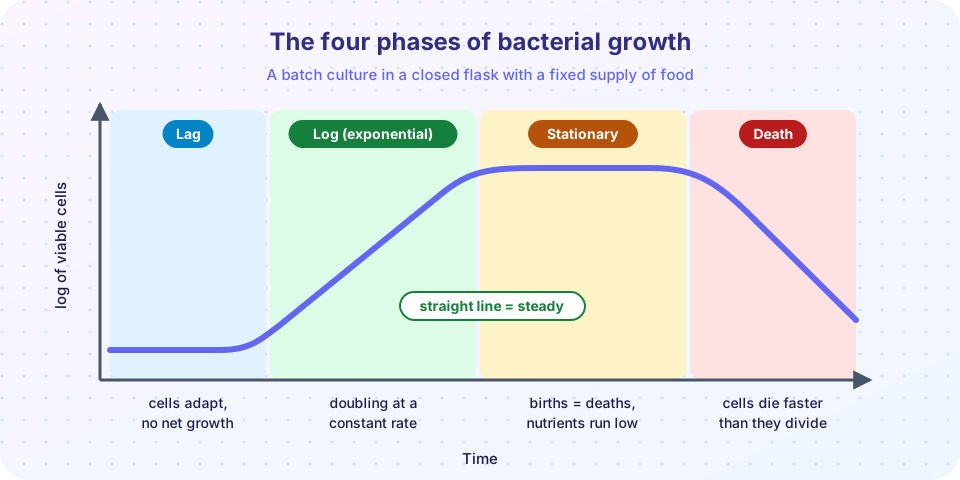
When bacteria are placed in fresh medium in a closed flask (a batch culture), the population passes through four stages, plotted best on a log scale:
- Lag phase. Cells are adjusting. They are not dividing yet, but they are busy: making ribosomes, enzymes and the molecules needed for the new medium. Lag can last minutes to many hours, depending on the cells' history (old cultures take longer) and on how different the new medium is.
- Log (exponential) phase. Cells divide at a constant, maximal rate for the conditions, so a graph of log cells against time is a straight line. Cells are the most uniform and most sensitive to antibiotics that target growth, which is why laboratory tests use log-phase cultures.
- Stationary phase. Growth slows to zero because food is running out, waste (such as acids) accumulates or oxygen is short. New cells appear about as fast as old cells die. Cells switch to a survival program: some make endospores; others produce secondary metabolites, including antibiotics in the case of Streptomyces.
- Death phase. Cells die faster than new cells form, usually at an exponential rate again. Some remain alive in a dormant state and can be revived, so death in a culture is slower than the curve suggests.
A variation is the "diauxic" shift: when two sugars are present, bacteria first use the preferred one (glucose), pause, then switch to the second (for example lactose), giving two growth spurts. Jacques Monod described this in the 1940s.
In nature, the equivalent of a closed flask is rare, and bacteria spend most of their time in a lean, stationary-like state. Medical bacteriology still uses the curve because it explains important behavior: an infection starts with a lag, then grows exponentially until immune defenses or nutrient limits intervene.
Press Run (or Ctrl + Enter) to see the result here.
Program input · what you'd type while the program runs
Type the answers before you press Run, one per line. Each time the program reads a line (with input()), it gets the next line from this box.
Measuring growth
- Viable (plate) count. Dilute and plate, count colonies (Chapter 1). It counts only living cells that can form colonies, but takes a day.
- Direct microscopic count. Count cells in a counting chamber with a known volume. It is fast but counts dead cells too.
- Turbidity. A spectrophotometer measures how much light a culture scatters, usually as optical density at 600 nm (OD₆₀₀). It is quick and non-destructive, and reasonably proportional to cell number at low densities (roughly OD below 0.4 to 0.5), but it must be calibrated against plate counts and cannot tell live from dead.
- Dry weight, protein content or metabolic activity are used when cells are too clumped to count.
- Most probable number (MPN) uses dilution tubes and statistics when plating is impractical, such as in water testing.
Generation times in the real world
E. coli in rich broth at 37 °C divides in about 20 minutes. Many soil and water bacteria are far slower, dividing in hours or days. Mycobacterium tuberculosis takes roughly 15 to 20 hours per generation, which is why TB cultures take weeks to grow and why TB treatment lasts months. Fast generation also means fast evolution: a population can accumulate mutations and select resistant variants in days.
Common misconceptions
"Bacterial growth means cells get bigger." In microbiology it means increase in number.
"The log phase is when bacteria grow logarithmically." It is exponential growth; it looks like a straight line on a logarithmic axis, which is where the name comes from.
"A turbid culture is all alive." Turbidity measures cells of any kind, living or dead.
Check your understanding
Quick check · 5 questions
of 5 answered You scored / 5 · perfect!
-
1. A culture starts with 100 cells and the generation time is 30 minutes. How many cells after 2 hours of exponential growth?
2 hours = 4 generations, so N = 100 × 2⁴ = 1,600. -
2. In which phase are cells most uniform and most susceptible to growth-targeting antibiotics?
Cells in log phase are actively growing and dividing at a constant rate. -
3. Why does a log-scale plot of exponential growth give a straight line?
Each doubling adds log₁₀ 2 ≈ 0.30 to log N, so the graph rises at a constant slope. -
4. Which method counts only live cells that can form colonies?
Colonies grow only from living, culturable cells. -
5. What best describes the stationary phase?
Cell division balances cell death; growth is limited by food, waste or space.
Summary
- Bacteria divide by binary fission, guided by the FtsZ ring; replication can overlap divisions in fast growers.
N = N₀ × 2ⁿ,n = 3.32 × (log N − log N₀),g = t / n.- The batch growth curve has lag, log, stationary and death phases.
- Growth is measured by plate counts, microscope counts, turbidity and other methods; each has strengths and limits.
Track your progress
Create a free account to tick off lessons and pick up where you left off on any device.
of Microbiology lessons completed