


















Lesson 44 of 47 · Projects and Practice
Project: Simulate a Savings Default
Build an agent-based model of opt-in, opt-out and active choice, measure participation and fit, find a good default rate, and learn what simulations can and cannot show.
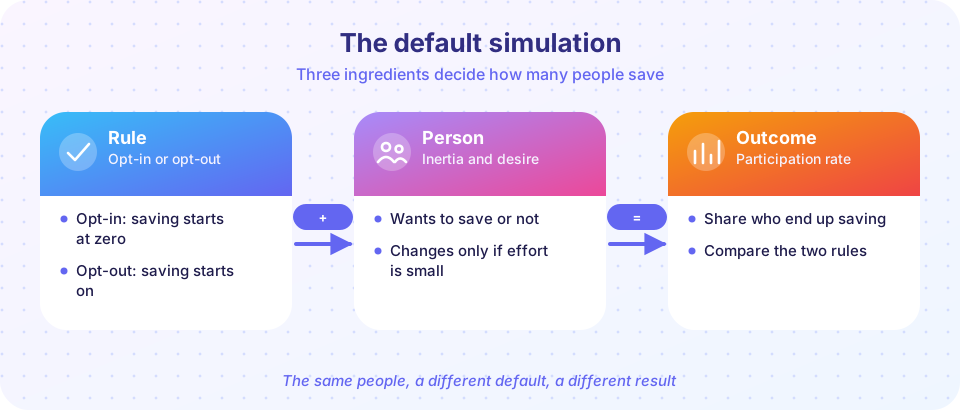
The lesson on defaults gave a three-line formula for participation. A formula hides a lot: people differ in how much they want to save, in how likely they are to act, and in how far a default misses what they would have chosen. In this project you build a small agent-based model: thousands of simulated employees, each with her own preference and her own inertia, facing different default rules. The output is not a prediction about real workers. It is a way to see how a few assumptions interact, and to ask which default rate a designer should pick.
What you will learn
- How to build a simple agent-based model step by step.
- How to measure participation, average savings rate and mismatch between what people do and what they want.
- Why the best default rate depends on the spread of people's preferences, and is close to the median.
- What an assumption-driven simulation can and cannot show.
Key terms
Agent: one simulated person with her own preference and behavior rule.
Desired rate: the savings rate the person would choose after careful thought.
Mismatch: the average absolute gap between the rate a person ends up with and her desired rate.
Median: the middle value of a distribution; the number that minimizes the average absolute gap to everyone.
Calibration: choosing parameters so that the model reproduces a known fact.
Step 1: the agents
Each of the 20,000 agents has two traits.
- A desired savings rate. With probability
w = 0.75she wants to save, and her desired rate is a whole number between 4 and 12 percent of pay, equally likely. With probability 0.25 she does not want to save: her desired rate is 0. (The average desired rate over everyone is 6 percent.) - A chance of acting. With probability
a = 0.5she gets around to making an active decision; otherwise she stays with whatever the default gives her.
These numbers are assumptions chosen so that the model reproduces the 37-percent versus 86-percent pattern in the Madrian-Shea study. They are not estimates of any real workforce.
Step 2: the rules
- Opt-in (default 0 percent): the agent who acts moves to her desired rate; the others remain at 0.
- Opt-out with default rate
r: the agent who acts moves to her desired rate; the others stay atr. - Active choice: everyone chooses, so everyone ends up at her desired rate. (This idealizes active choice: in real life, rushed choices contain errors.)
Step 3: the measures
- Participation: the share with a rate above 0.
- Average rate: mean rate across all agents.
- Mismatch: the mean of
|rate − desired rate|. - Unwanted enrollment: the share who are saving although they would not choose to.
Step 4: what happens
Running the model (first TryIt) gives results like these, with 20,000 agents and a fixed random seed:
| Rule | Participation | Average rate | Mismatch |
|---|---|---|---|
| Opt-in (0%) | 37.5% | 3.0% | 3.04 |
| Opt-out at 3% | 88% | 4.5% | 2.27 |
| Opt-out at 6% | 88% | 6.0% | 1.76 |
| Opt-out at 8% | 88% | 7.0% | 1.84 |
| Opt-out at 12% | 88% | 9.1% | 3.02 |
| Active choice | 75% | 6.0% | 0 |
The table teaches several things.
- Opt-out raises participation by the same amount whatever the default rate, because participation depends only on whether the default is above zero.
- But the rate matters for fit. A default of 3 percent leaves many people saving less than they want, and 12 percent pushes many above what they want. The mismatch is lowest for defaults near the middle.
- The unwanted-enrollment cost is the same for every opt-out rate. About 12.5 percent of people end up saving although they would not choose to. Whether that is acceptable depends on how costly saving is for them, which the model does not include.
- Active choice looks best here only because the model assumes perfect decisions, and because it gives the lowest participation (75 percent), it may not be preferred by a designer whose goal is participation.
The best default is the median
If the cost of a mismatch is proportional to its size, the default that minimizes the average gap is the median of the desired rates. Here half the people want a rate at or below about 6, so a default of 6 to 7 percent minimizes mismatch. A designer who cares more about under-saving than over-saving would choose a higher default; one who worries about people with debts would choose a lower one. That is a value judgment, not something the simulation settles. The second TryIt scans all defaults from 0 to 15 percent to show the minimum.
Step 5: extensions
Change the model and predict the result before you run it.
- Lower attention. Set
a = 0.2. Does opt-out matter more or less? (It matters more: more people stay at the default.) - A different mix. Set
w = 0.5so that half the population does not want to save. How does unwanted enrollment change? - Heterogeneous attention. Give people with high desired rates a higher
a. Does the best default move? - Auto-escalation. Let the default rise by 1 point a year up to a cap. How does the average rate after five years compare with a fixed default?
What this model cannot tell you
- Whether the assumed preferences are right. The 4 to 12 percent range is made up.
- How people react to the default as advice (endorsement). Some people would treat a 6 percent default as a recommendation and not go above it.
- Side effects, such as extra borrowing for people who would be better off paying debts first.
- What happens over decades, with changing jobs and pay.
A good habit is to write these limits next to any simulation result you share.
Common misconceptions
"The simulation shows the optimal default." It shows the optimum for the assumed preferences and loss function.
"Opt-out is best because participation is highest." Participation is one measure; mismatch and unwanted enrollment matter too.
"If the model reproduces one fact it must be right." Many different models can match one number. Test its other predictions.
Try it
First, the full simulation. It builds the agents, applies each rule and prints the four measures, then plots participation and mismatch side by side. It is a model with assumed parameters.
Press Run (or Ctrl + Enter) to see the result here.
Program input · what you'd type while the program runs
Type the answers before you press Run, one per line. Each time the program reads a line (with input()), it gets the next line from this box.
Second, scan every default rate from 0 to 15 percent and find the one that minimizes mismatch for two different populations: the one above (w = 0.75) and one in which fewer people want to save (w = 0.6).
Press Run (or Ctrl + Enter) to see the result here.
Program input · what you'd type while the program runs
Type the answers before you press Run, one per line. Each time the program reads a line (with input()), it gets the next line from this box.
Third, an interactive version using exact formulas instead of random draws. Move the sliders and compare participation, the average rate and the mismatch for an opt-out default. Desired rates for savers are equally likely to be any whole number from 4 to 12.
Check your understanding
Quick check · 5 questions
of 5 answered You scored / 5 · perfect!
-
1. In the model, why does participation under opt-out not depend on the default rate (as long as it is above zero)?
Any positive default enrolls those who do not act, so participation is the same for any positive rate. -
2. Which default rate minimizes the average absolute mismatch?
The median minimizes the average absolute gap to all values. -
3. Why does active choice look best in the model?
Real active choices contain errors and can lower participation, which this idealization leaves out. -
4. What can a simulation like this NOT tell you?
The assumptions must be checked against data. -
5. If you set a = 0.2, what should happen to the effect of the default?
Lower attention means more people keep whatever the default gives them.
Summary
- An agent-based model combines each person's preference and inertia with a default rule and reports participation, average rate and mismatch.
- Opt-out raises participation whatever the positive default rate, but the rate sets how well it fits what people want.
- With a mismatch measured as an absolute gap, the best default is close to the median desired rate; value judgments can shift it.
- Always state the assumptions and what the model leaves out.
Next: Glossary
Track your progress
Create a free account to tick off lessons and pick up where you left off on any device.
of Behavioral Economics lessons completed