


















Lesson 43 of 47 · Projects and Practice
Project: Design a Behavioral Experiment
A step-by-step project: plan a randomized test of a nudge, choose the outcome, calculate sample size and power, avoid peeking and p-hacking, and write an analysis plan.
Reading about experiments is not the same as designing one. In this project you will plan a small randomized trial of a nudge from start to finish: a question, a hypothesis, an assignment method, an outcome, a sample size and an analysis plan. You will also see by simulation how a common shortcut, checking results as they come in and stopping when they look good, produces false alarms. The example is hypothetical, and you are encouraged to replace it with a question of your own that you could really test, for instance in a school club, a community group or an online newsletter.
What you will learn
- How to turn an idea into a testable hypothesis with a single outcome.
- How to randomize and why it matters.
- How to calculate power and sample size for a two-group comparison.
- Why peeking and multiple outcomes inflate false positives, and what an analysis plan contains.
Key terms
Null hypothesis: the assumption that the nudge has no effect.
Type I error (false positive): concluding there is an effect when there is none; usually limited to 5 percent.
Power: the probability of detecting an effect of a given size; usually targeted at 80 percent.
Minimum effect of interest: the smallest difference that would be worth acting on.
Intention to treat: analyzing people in the groups they were assigned to, whether or not they followed the treatment.
Step 1: a question and a hypothesis
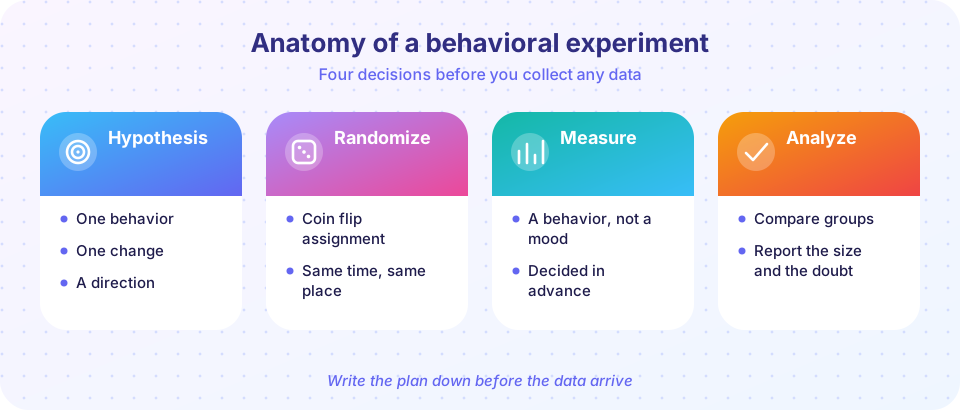
The hypothetical example: a student society sends an email asking members to sign up to help at its annual event. Currently 20 percent of members who receive the email sign up. You suspect that adding one sentence, "most members signed up last year" (a descriptive social norm), will raise sign-ups, but only if it is true; if it is not, do not use it. State a hypothesis that names one behavior, one change and a direction:
Adding the social norm sentence increases the share of recipients who sign up within seven days.
Decide the minimum effect of interest now. If a 2-point gain (20 to 22 percent) would not change what the society does, there is no reason to design a test to find it. Say a 5-point gain is the smallest worth acting on.
Step 2: randomize
Randomization makes the two groups comparable on average in everything, including things you cannot measure, such as how keen people are. If instead you send the norm email to the first 200 members on the list, you may compare more active members with others. Use a random number generator or a shuffled list. For small groups, block randomization shuffles within sub-groups to keep the numbers balanced (the third TryIt does this). Do not let anyone choose who gets which version.
Other design choices include whether participants know they are in a study (ethics and honesty require appropriate consent and no harmful deception), and whether people in the two groups can talk to each other, which could contaminate the comparison.
Step 3: the outcome
Choose a behavior you can measure objectively (signed up or not), not a mood or intention. Define it precisely: signed up within seven days of the email. Decide in advance whether to count people who unsubscribe, bounce or never open the email. A good rule is intention to treat: everyone who was sent the email is counted, in the group to which they were assigned.
Pick one primary outcome. Looking at many outcomes and reporting the one that worked is a source of false positives.
Step 4: sample size
How many members do you need per group? For a two-proportion comparison with a 5 percent false positive rate and 80 percent power, the normal approximation gives
n per group ≈ (z_α/2 + z_β)² × [p1(1 − p1) + p2(1 − p2)] / (p2 − p1)²
With z_α/2 = 1.96, z_β = 0.84, p1 = 0.20 and p2 = 0.25:
n ≈ 7.85 × (0.16 + 0.1875) / 0.0025 ≈ 1,091 per group
So you need about 1,100 members per group, 2,200 in all. If your society has 300 members, the test is not feasible, and running it anyway will give an inconclusive answer. In that case, increase the sample (a larger organization, repeated mailings), aim for a larger effect, or accept that you can only collect evidence for a later, bigger study. The first TryIt below computes this and plots power against sample size.
Step 5: do not peek (and other pitfalls)
Suppose you check the results every time 200 more people have been mailed, and stop as soon as the difference looks significant. The false-positive rate is then much higher than 5 percent, even if the nudge does nothing. The second TryIt shows this in a simulation of "A/A tests", where both groups get the same email: a single test at the end gives roughly 5 percent false positives (the run below shows 5.7 percent because of sampling noise), five looks about 14 percent, and ten looks about 19 percent.
Other pitfalls:
- Multiple outcomes or subgroups. Testing many outcomes or slicing the data until something is significant. Pre-specify the primary outcome; label the rest exploratory.
- Attrition. If more people drop out of one group, the groups are no longer comparable.
- Spillovers. If members forward the email, the groups interact.
- Not publishing null results. A well-run test that finds no effect is informative.
- Ethics. Do not deceive or harm participants, protect their data, and follow the rules of your organization or school for research.
Step 6: the analysis plan
Write this before collecting data:
- Hypothesis and primary outcome.
- Population and how people are randomized.
- Sample size and stopping rule (a fixed number, no peeking).
- Analysis: the difference in proportions with a 95 percent confidence interval; and the decision rule (for example, "adopt the norm if the lower bound of the interval is above zero and the estimate is above the minimum effect").
- Planned secondary analyses, labeled as exploratory.
When you report, include the effect size and its interval, not only whether it was significant.
Common misconceptions
"A significant result proves the nudge works." A single significant result can be a false positive, especially if the study was underpowered or the analysis flexible.
"A non-significant result proves the nudge does not work." It may mean that the study was too small to detect the effect. Look at the interval.
"More outcomes are better." Each additional outcome tested adds a chance of a false positive.
Try it
First, compute the sample size for different effect sizes and plot power against the number per group for a 20 percent baseline. The calculation uses the normal approximation formula from the lesson.
Press Run (or Ctrl + Enter) to see the result here.
Program input · what you'd type while the program runs
Type the answers before you press Run, one per line. Each time the program reads a line (with input()), it gets the next line from this box.
Second, the cost of peeking. The simulation runs thousands of A/A tests in which both groups have a true 20 percent sign-up rate, so any "significant" result is a false positive, and counts how often at least one look is significant. It uses 200 people per group per look. The numbers come from the simulation (fixed random seed).
Press Run (or Ctrl + Enter) to see the result here.
Program input · what you'd type while the program runs
Type the answers before you press Run, one per line. Each time the program reads a line (with input()), it gets the next line from this box.
Third, a randomizer. Paste a list of participant IDs, one per line; the tool shuffles them and assigns them to two groups of as equal size as possible. In real work, record the random seed or the list so the assignment can be audited.
Check your understanding
Quick check · 5 questions
of 5 answered You scored / 5 · perfect!
-
1. Why randomize assignment?
Random assignment breaks the link between who gets the treatment and who the people are. -
2. A baseline of 20 percent and a hoped-for effect of 5 points need roughly how many people per group for 80 percent power?
The normal approximation gives about 1,090 per group. -
3. What happens to the false positive rate if you stop the test as soon as a result looks significant?
Each look is another chance for a chance fluctuation to cross the threshold. -
4. What is intention to treat?
Keeping the analysis in assigned groups preserves the benefit of randomization. -
5. A study finds no significant effect with only 100 people per group. What can you conclude?
Low power means a real, modest effect could easily be missed; look at the interval.
Summary
- A good experiment starts with a single behavior, one change and a pre-specified outcome.
- Randomize, use intention to treat and decide the sample size in advance.
- For a 20 percent baseline and a 5-point effect you need about 1,100 people per group.
- Peeking and multiple outcomes inflate false positives; write an analysis plan first and report effect sizes with intervals.
Track your progress
Create a free account to tick off lessons and pick up where you left off on any device.
of Behavioral Economics lessons completed