


















Lesson 15 of 48 · Stellar Structure and Evolution
The HR diagram and the main sequence
Read the Hertzsprung-Russell diagram: how luminosity and temperature sort stars into the main sequence, giants, supergiants and white dwarfs, and how to find radius, mass and lifetime.
Around 1910 Ejnar Hertzsprung in Denmark and Henry Norris Russell in the United States plotted stars' luminosities against their spectral types and discovered that stars do not fill the plot at random. They fall along a few well-defined bands. The Hertzsprung-Russell (HR) diagram is the single most useful chart in stellar astrophysics, because a star's position on it tells you its size and, through the physics of stellar evolution, its mass and age.
What you will learn
- How to read an HR diagram, including its backwards temperature axis.
- Why the main sequence is a mass sequence, and what the other regions are.
- How to get a star's radius from its position, using
L = 4π R² σ T⁴. - How mass sets luminosity and lifetime on the main sequence.
Key terms
Main sequence: the band of stars fusing hydrogen in their cores; position depends mainly on mass.
Giant / supergiant: a star with a large radius and high luminosity after leaving the main sequence.
White dwarf: the hot, dense, faint remnant of a low-mass star.
Luminosity class: Roman numerals (I supergiants, III giants, V main sequence) that describe a star's size class.
Turn-off point: the position on the main sequence where a cluster's stars are just leaving it; it tells you the cluster's age.
Reading the diagram
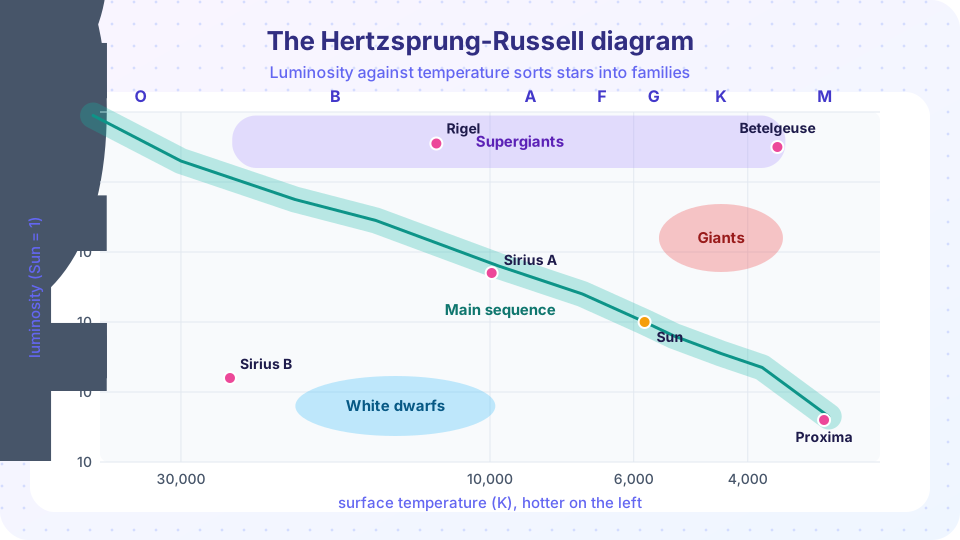
The vertical axis is luminosity (or absolute magnitude), usually on a logarithmic scale from about 10⁻⁴ to 10⁶ times the Sun's. The horizontal axis is surface temperature (or spectral class, or colour index B − V), traditionally increasing to the left, from cool red M stars at the right to hot blue O stars at the left. The reversed axis is a historical accident: the spectral sequence was ordered before anyone knew it was a temperature sequence.
Because L = 4π R² σ T⁴, you can rearrange for the radius:
R / R☉ = (L / L☉)^(1/2) × (5772 K / T)²
Lines of constant radius therefore run diagonally across the diagram, from top-left to bottom-right. Giants at the upper right, cool but luminous, must be huge. A star at 3,600 K with L = 10⁵ L☉ has R / R☉ = √(10⁵) × (5772/3600)² ≈ 316 × 2.57 ≈ 810: a red supergiant like Betelgeuse, so large that in our Solar System it would reach beyond Mars. White dwarfs at lower left, hot but faint, must be tiny: Sirius B has T ≈ 25,200 K and L ≈ 0.025 L☉, so R / R☉ ≈ 0.158 × (5772/25200)² ≈ 0.0083, a little smaller than Earth (0.0092).
The main sequence
About 90% of stars lie on a diagonal band from hot, bright, massive stars at the upper left to cool, faint, light stars at the lower right. These are stars fusing hydrogen in their cores, the stage that lasts the longest. Along the sequence, mass is the controlling variable, and two relations follow:
- Mass-luminosity:
L ∝ M^3.5roughly (between about 2 and 20 solar masses); the exponent is smaller for low-mass stars and larger in the range 0.43–2 where it is closer to 4. - Lifetime: fuel is proportional to
M, burn rate toL, sot ∝ M / L ∝ M^−2.5. A 10 M☉ star lives about10 Gyr × 10^−2.5 ≈ 30 million years, a 0.5 M☉ star more than 50 billion years.
Mass also sets the radius and temperature on the main sequence: from roughly 0.1 solar masses (the lowest mass that can fuse hydrogen steadily) up to over 100 solar masses.
Other regions
- Red giants (upper right of the main sequence, luminosity class III): stars that have exhausted core hydrogen and now burn it in a shell around an inert helium core while the outer layers swell and cool.
- Supergiants (class I, along the top): the evolved stage of massive stars, 10⁴ to 10⁶ times as luminous as the Sun.
- White dwarfs (lower left): cooling remnants with about the mass of the Sun in Earth's volume.
- Horizontal branch and other features appear in clusters of old stars when they start burning helium.
Using the HR diagram on clusters
A cluster's stars formed together, at the same distance, from the same material. On an HR diagram they trace a single clean curve. The most massive stars die first, so the upper end of the main sequence peels off ("turn-off"). A cluster whose turn-off is at the Sun's luminosity is about 10 billion years old; one with a turn-off at B stars is only tens of millions of years old. This is how astronomers measure the ages of star clusters, and, through the oldest globular clusters, set a lower limit on the age of the universe.
Common misconceptions
"The HR diagram shows how stars move through space." It plots properties, not positions. Stars move across it only slowly as they evolve.
"Stars on the main sequence are all like the Sun." The main sequence spans a factor of a million in luminosity and over a thousand in mass.
"A cool star must be dim." Cool giants and supergiants are among the brightest stars, because they are enormous.
Try it
First, draw an HR diagram with lines of constant radius. Use the plot to read off roughly how large each region's stars must be.
Press Run (or Ctrl + Enter) to see the result here.
Program input · what you'd type while the program runs
Type the answers before you press Run, one per line. Each time the program reads a line (with input()), it gets the next line from this box.
Second, compute radii and main-sequence lifetimes from the formulas for several stars. The values are approximate.
Press Run (or Ctrl + Enter) to see the console output here.
No output.
Check your understanding
Quick check · 5 questions
of 5 answered You scored / 5 · perfect!
-
1. A star is cool (3,500 K) but very luminous. It must be
L = 4 pi R^2 sigma T^4: with low T, a high L requires a huge radius. -
2. Where on the HR diagram would you find a faint, hot, tiny star?
White dwarfs are hot but faint because they are about the size of Earth. -
3. A cluster's main sequence turns off at luminosity 1,000 times the Sun's. The cluster is
More luminous stars live shorter, so a high turn-off point means the cluster is young. -
4. On the main sequence, lifetime scales roughly as
t is proportional to M / L and L is roughly M^3.5. -
5. Why is the temperature axis of an HR diagram reversed?
Spectral classes were ordered long before they were known to be a temperature sequence.
Summary
- The HR diagram plots luminosity against temperature; position reveals radius and evolutionary stage.
- About 90% of stars are on the main sequence, which is a mass sequence:
L ∝ M^3.5,t ∝ M^−2.5. - Giants and supergiants are large and cool; white dwarfs are small and hot.
- The turn-off of a cluster's main sequence gives its age.
Next: Stellar evolution paths
Track your progress
Create a free account to tick off lessons and pick up where you left off on any device.
of Astrophysics and Cosmology lessons completed