


















Lesson 19 of 43 · Transportation and Mobility
Traffic and Induced Demand
Learn how planners model trips with the four-step model, why congestion persists, what induced demand and Braess's paradox show, and which tools actually reduce traffic.
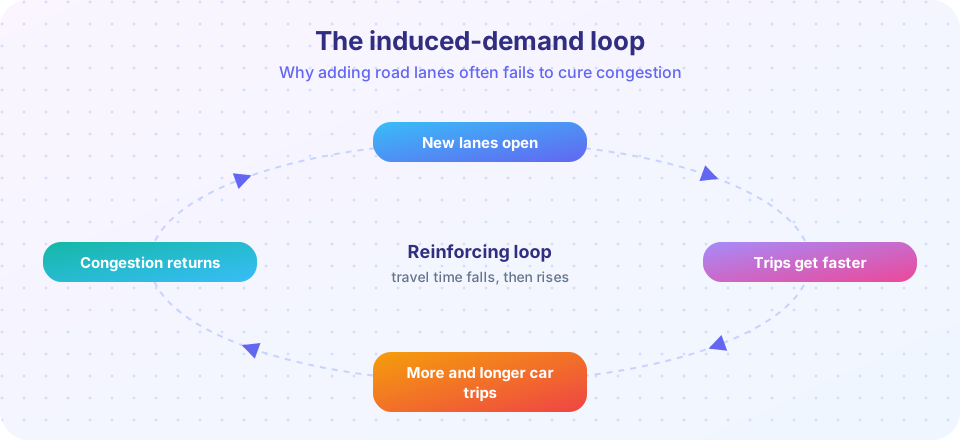
A city is jammed, so it widens the highway. For a year or two, the traffic eases. Then the new lanes fill up, and the jam is back, sometimes worse. This pattern is so common that transport researchers have given it a name, induced demand, and a body of evidence behind it. It is one of the most important, and least intuitive, ideas in transport planning.
This lesson explains how planners model travel, why congestion has the behavior it does, what economists and engineers have found about road building, and which policies tend to work. You will run a small simulation that reproduces the effect.
What you will learn
- The four-step travel demand model.
- How travel time rises with traffic volume.
- What induced demand is and what research shows.
- Why adding capacity often fails, and which tools work better.
Key terms
Congestion: delay caused when too many vehicles use a road; time rises sharply as volume approaches capacity.
Volume-to-capacity ratio (v/c): the number of vehicles divided by the road's capacity.
Induced demand: additional travel that occurs because travel has become easier, faster or cheaper.
Vehicle-kilometers traveled (VKT): the total distance driven by all vehicles in an area.
Congestion pricing: charging drivers to use roads at busy times.
How planners model travel
The classic tool is the four-step model, developed in the 1950s and still the basis of many regional models.
- Trip generation. How many trips start and end in each zone? Homes produce trips (to work, school, shops), and workplaces and shops attract them.
- Trip distribution. Where do the trips go? A common approach is the gravity model: trips between two zones increase with their sizes and decrease with the distance or travel cost between them, like gravity between masses.
- Mode choice. How do people travel, by car, transit, bike or on foot? Time, cost and convenience determine the choice.
- Route assignment. Which paths do trips take? Drivers choose routes, and the result is traffic volumes on each link.
Models are useful but depend on assumptions. Early versions held trip generation and distribution fixed even when the network changed, so adding capacity appeared to reduce delay without drawing in new trips. Modern models allow travel to respond to travel times, but not always well enough.
Why delay explodes near capacity
Travel time on a road is not proportional to the number of vehicles. When a road is quiet, adding a car adds almost no delay. Near capacity, each extra car slows all the others. A widely used equation from the US Bureau of Public Roads (the BPR function) captures this:
t = t0 × (1 + 0.15 × (v / c)⁴)
Here t0 is the free-flow travel time, v is volume, and c is capacity. At half capacity the delay factor is only 1.01, but at capacity it is 1.15, and at 1.5 times capacity it is 1.76. The fourth power gives the sharp bend. Because the slope is so steep near capacity, a small increase in demand can cause a large jump in delay, and a small decrease in demand can cause a large improvement. That is why even a modest number of cars removed from a congested road can speed things up, and why a modest number added can bring it to a halt.
The induced demand evidence
Why do new lanes fill? Because they change behavior in many ways:
- People who drove at other times or on other routes move to the faster road.
- People who took transit, walked or carpooled switch to driving.
- People make trips they previously skipped, or choose destinations farther away.
- Over years, development shifts outward to take advantage of better access, creating new trips.
Economists Gilles Duranton and Matthew Turner studied US metropolitan areas in a 2011 paper in the American Economic Review, "The Fundamental Law of Road Congestion". They found that vehicle-kilometers traveled grew roughly in proportion to the kilometers of highway lanes added: an elasticity close to 1. In plain terms, in the cities they studied, adding lanes led to approximately equivalent growth in driving, so congestion did not fall for long. Other studies find somewhat smaller short-run effects, so the exact size varies, but the direction is consistent: new capacity is partly, and over time largely, used up.
Two related ideas help explain stubborn congestion.
- The Downs-Thomson paradox, named for the economists Anthony Downs and J. M. Thomson, says that the equilibrium speed of car traffic on a road tends to be set by the speed of the best alternative, such as a parallel rail line. If you improve the road, more people switch from rail, rail service worsens, and the balance is restored at a similar travel time.
- Braess's paradox, described by the mathematician Dietrich Braess in 1968, shows that adding a new link to a road network can sometimes increase everyone's travel time, because drivers each pick their own best route without regard to the effect on others.
A related finding is the travel time budget, associated with Yacov Zahavi and Cesare Marchetti: across many cultures and centuries, people spend on average about an hour a day traveling. When transport gets faster, people tend to travel farther rather than save time, which is one reason cities spread out as speeds rose.
What works instead
If widening roads does not cure congestion, what does?
- Pricing. Charging for road use at busy times removes the lowest-value trips. Singapore introduced area licensing in 1975 and electronic road pricing later; London's congestion charge began in 2003; Stockholm's began as a trial in 2006, and New York began charging for entering part of Manhattan in 2025. Studies of these systems typically report reductions in traffic in the charged zone, with revenue used for transit, though schemes differ in design and political acceptance.
- Parking management. Charging fairly for parking and removing minimum requirements discourages unnecessary driving.
- Better alternatives. Frequent, fast transit, safe cycling and walkable neighborhoods give people real choices, and reduce the number of trips that must be made by car.
- Land use. Putting homes, jobs and services closer together shortens trips and cuts demand.
- Managing the road. Signal timing, bus priority, ramp metering and information systems help, though their gains can also be used up over time.
This does not mean roads are never worth building. A new link can open access to an area without service, reduce truck delays or fix a safety problem. The lesson is that capacity added to a congested urban road should not be expected to cure congestion on its own, and that planners should model induced travel honestly when making the case.
Common misconceptions
"If it didn't help, the road wasn't big enough." Induced demand means that the road may fill again however large it is, since new trips keep appearing until delay discourages them.
"Congestion is the main transport problem." Congestion is a visible symptom, but safety, emissions, cost, access for non-drivers and land consumed by roads and parking are just as important.
"Congestion charging just punishes drivers." Pricing uses the road more efficiently, and revenue can fund alternatives. Fairness, however, depends on how revenue is used and whether alternatives exist, and this is part of the debate.
Try it
First, a simulation. Drivers decide whether to make a trip based on its travel time, and travel time depends on how many make the trip. We find the equilibrium before and after adding 33 percent more capacity. The demand and capacity values are illustrative, so the result shows the mechanism and not a forecast for any real road.
Press Run (or Ctrl + Enter) to see the result here.
Program input · what you'd type while the program runs
Type the answers before you press Run, one per line. Each time the program reads a line (with input()), it gets the next line from this box.
Second, a gravity model for trip distribution. Three zones with different numbers of homes (producing trips) and jobs (attracting trips), and a distance matrix. Trips fall with the square of distance. The numbers are invented.
Press Run (or Ctrl + Enter) to see the console output here.
No output.
Check your understanding
Quick check · 5 questions
of 5 answered You scored / 5 · perfect!
-
1. What is induced demand?
When capacity expands and travel time falls, more and longer trips are made, partly offsetting the gain. -
2. Duranton and Turner (2011) found that vehicle-kilometers traveled grew roughly:
They estimated an elasticity close to 1: driving grew about as fast as road capacity. -
3. In the BPR function, what happens to travel time as v/c rises from 0.5 to 1.5?
The fourth power makes the delay curve bend sharply upward near and above capacity. -
4. Braess's paradox shows that:
When each driver chooses a personally best route, a new link can worsen the overall equilibrium. -
5. Which policy is associated with reducing traffic in a charged zone, as seen in London from 2003?
Charging for use at busy times removes lower-value trips and raises revenue for alternatives.
Summary
- The four-step model estimates trip generation, distribution, mode choice and route assignment.
- Delay rises steeply near capacity, so small changes in volume have large effects on travel time.
- Induced demand means new lanes are often largely filled by new trips; Duranton and Turner found a near one-to-one response in US cities.
- Pricing, parking management, alternatives and land-use change tend to work better than widening alone.
Next: Chapter 4 Review
Track your progress
Create a free account to tick off lessons and pick up where you left off on any device.
of Urban Planning lessons completed