


















Lesson 12 of 43 · Land Use and Zoning
Density and Land Value
Learn how planners measure density and floor area ratio, why land value falls with distance from the center, and how von Thunen, Alonso and Burgess explain urban form.
Ask ten people what "density" means and you will get ten answers. For one it means a crowded subway, for another a tall building, for a third it means no yard. Planners need a precise language, because density rules decide how many homes can be built, how many people can use a bus line and how much a parcel of land is worth. This lesson gives you that language, then explains why land prices form a pattern that has shaped cities for centuries.
By the end you will be able to compute density and floor area ratio for a real parcel, sketch a bid-rent diagram and explain why a skyscraper stands in a downtown but a farm sits at the edge.
What you will learn
- How to measure density: dwellings per hectare, floor area ratio, lot coverage.
- The difference between net and gross density.
- How land value depends on location and why it creates a density gradient.
- The bid-rent model and the classic models of city structure.
Key terms
Dwelling units per hectare (du/ha): the number of homes on a hectare of land (1 hectare = 10,000 square meters, about 2.47 acres).
Floor area ratio (FAR): total building floor area divided by lot area.
Lot coverage: the share of the lot covered by the building footprint.
Net density: density counted over residential land only; gross density counts the whole area, including streets, parks and schools.
Bid-rent: the maximum rent a user is willing to pay for land at each distance from the center.
Measuring density
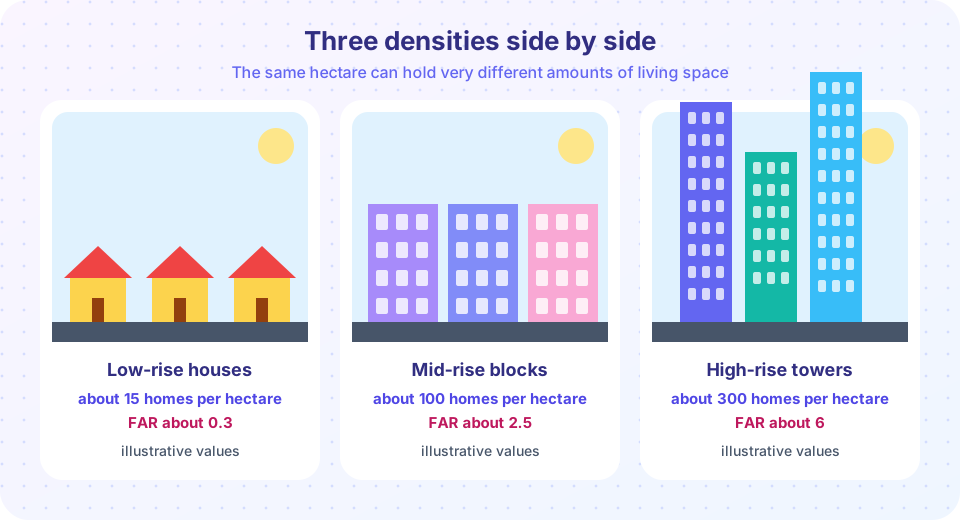
Dwelling units per hectare. Count the homes and divide by the land area. A street of detached houses on 600-square-meter lots, with some land lost to roads, might have 10 to 20 homes per hectare. Row houses may reach 40 to 70. Mid-rise apartment blocks can reach 100 to 200, and high-rise districts several hundred. These ranges are only rough guides, and the exact figures depend on home size and the share of land taken by streets and open space.
Floor area ratio (FAR). This is the total floor area of a building divided by the area of its lot. A one-storey building covering the entire lot has FAR 1.0. A two-storey building covering half the lot also has FAR 1.0. A ten-storey tower covering 40 percent of its lot has FAR 4.0. FAR is a better indicator of building bulk than height alone, because it accounts for both height and coverage.
Lot coverage. The building footprint divided by lot area. A limit of 40 percent leaves 60 percent of the lot for garden, parking and open space.
Net and gross density. Gross density includes streets and parks, so it is lower, and it is useful when you plan a whole neighborhood. Net density, counted only on the building lots, tells you how intensively each lot is used. Always check which one is meant: a statement like "30 units per hectare" can mean quite different things.
People versus homes. Density can also be counted in people per hectare. Because household sizes differ, 100 homes per hectare might hold 200 or 350 people.
Worked example
Consider a lot of 1,000 square meters with a zoning limit of FAR 2.0. The maximum floor area is 1,000 × 2.0 = 2,000 square meters. If the average apartment is 80 square meters and 15 percent of the floor area goes to stairs, hallways and walls, the usable area is 2,000 × 0.85 = 1,700 square meters, which holds about 21 apartments. On a 1,000 square meter lot, which is 0.1 hectare, that is 210 homes per hectare of net density. The FAR number in a zoning code therefore translates directly into how much housing, or how many jobs, a lot can hold.
Why does land have a price pattern?
Land is valuable where many people want to be: near jobs, markets, stations and amenities. Because everyone wants access, competition for central land pushes prices up, and prices fall as you move away. High land prices make builders use land more intensively, building taller and denser to spread the cost over more floor area. That is why downtowns have towers and the edges have fields or houses with gardens.
Von Thunen's rings
Long before modern cities, the German landowner and economist Johann Heinrich von Thunen described a similar pattern for farming in The Isolated State (1826). He imagined a single market town on a uniform plain. Products that are heavy, perishable or costly to transport, such as milk and vegetables, are grown close to town, and products with low transport costs per unit of value are grown farther out. Each crop is grown where it earns the most after transport costs, producing concentric rings. The model is a simplification, but it introduced the central idea: land value reflects access to markets.
The bid-rent model
In 1964 the economist William Alonso adapted this idea to cities in Location and Land Use. Each type of user, such as a retailer, an office firm or a household, has a bid-rent curve showing how much rent per square meter they would pay at each distance from the center. Retailers need foot traffic and gain a lot from being central, so their curve starts high and falls steeply. Offices value central access too, but less steeply. Households value space more than centrality, so their curve starts lower and falls slowly. At each location, land goes to the highest bidder. The result is a pattern of retail in the center, then offices, then housing, with the steeper bid-rent curves dominating near the center.
Classic models of city structure
Sociologists and geographers described the shapes cities seemed to take.
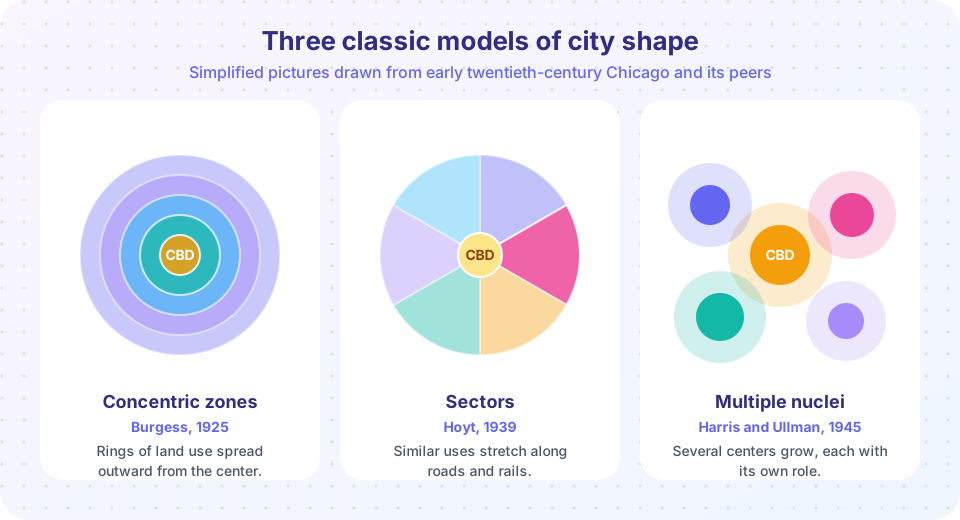
- Concentric zone model (Ernest Burgess, 1925). Based on Chicago, it proposed rings around the central business district: a zone of transition with industry and poor housing, then working-class homes, then better housing, then commuter suburbs. It captured the idea that the city grows outward from the center.
- Sector model (Homer Hoyt, 1939). Hoyt found that similar uses extend in wedges along transport routes. High-rent neighborhoods, for example, might form a sector extending from the center in one direction.
- Multiple nuclei model (Chauncy Harris and Edward Ullman, 1945). Cities develop around several centers, such as a port, a university, an industrial district and a suburban mall, not just one.
These models are all simplifications drawn mainly from North American cities in the early twentieth century, and they fit poorly in places with a different history, such as cities with wealthy centers (many in Europe) or informal settlements on the edge (many in the Global South). Modern cities are usually polycentric, with several job centers, and the models are best used as starting points for asking questions.
Taxing land value
Since land value arises from the community's presence, not from the owner's work, some economists have argued that it should be taxed. The American writer Henry George made this case in Progress and Poverty (1879), proposing a single tax on land value. Supporters say a land value tax discourages speculation and holding land idle, and encourages building. Critics raise questions about how to value land separately from buildings, fairness to owners and political feasibility. Several places use partial versions, including Denmark, Estonia and parts of Pennsylvania. The idea shows how economic analysis of land links directly to planning policy.
Common misconceptions
"High density means high-rise." Many compact, dense districts, such as Paris or Barcelona, are mostly five to seven storeys. A high-rise tower in a large park can have a lower overall density than a district of mid-rise blocks.
"Density causes crowding." Density is a measure of people or homes per area, while crowding is a feeling or a measure of persons per room. Dense districts can feel pleasant, and sprawling ones can feel crowded indoors.
"The classic models describe every city." They are historical generalizations from a few cities and periods. Use them to start questions, not to end them.
Try it
Compute the capacity of a parcel from its zoning rules. Change the lot size, FAR or the unit size and run the cell.
Press Run (or Ctrl + Enter) to see the result here.
Program input · what you'd type while the program runs
Type the answers before you press Run, one per line. Each time the program reads a line (with input()), it gets the next line from this box.
Now the bid-rent model. Each user has a straight-line bid-rent curve (rent index against distance). Land goes to the highest bidder at every distance, so the model predicts where retail, offices and housing end up. The numbers are invented to show the logic.
Press Run (or Ctrl + Enter) to see the result here.
Program input · what you'd type while the program runs
Type the answers before you press Run, one per line. Each time the program reads a line (with input()), it gets the next line from this box.
Check your understanding
Quick check · 5 questions
of 5 answered You scored / 5 · perfect!
-
1. A 2,000 m2 lot has a FAR limit of 3.0. What is the maximum floor area?
Maximum floor area = lot area times FAR = 2,000 x 3.0 = 6,000 m2. -
2. Which is true of gross density compared with net density for the same area?
Gross density divides by the whole area, including streets and open space, so it is lower than net density. -
3. In the bid-rent model, which user usually has the steepest curve?
Retailers depend on foot traffic and central access, so they bid highest in the center and their bids fall quickly with distance. -
4. Who proposed the sector model of urban structure?
Homer Hoyt (1939) described wedge-shaped sectors along transport routes. Burgess proposed concentric zones, and Harris and Ullman multiple nuclei. -
5. Which statement about density is best?
Mid-rise blocks that cover most of their land can have higher density than towers in open parkland.
Summary
- Planners measure density as dwellings per hectare, FAR and lot coverage, and distinguish net from gross density.
- FAR times lot area gives the maximum floor area; this turns zoning numbers into homes or jobs.
- Land value falls with distance from the center because access is valuable, which creates a density gradient.
- Von Thunen, Alonso's bid-rent and the Burgess, Hoyt and Harris-Ullman models explain urban structure, with important limits.
Next: How Zoning Works
Track your progress
Create a free account to tick off lessons and pick up where you left off on any device.
of Urban Planning lessons completed