


















Lesson 22 of 43 · Housing and Equity
Housing affordability and markets
Learn how planners measure housing affordability with the 30 percent rule, cost burden and area median income, and why housing markets behave differently from most markets.
"Affordable" is one of the most abused words in planning. A developer may call a new apartment affordable because it costs less than the luxury unit next door, while a family earning the local median wage still cannot pay for it. To talk clearly, planners use a few precise measures that turn the feeling of being squeezed into numbers you can compare across households, neighborhoods and cities.
In this lesson you will learn the main measures (cost burden and area median income), see why housing is a peculiar market with slow supply and a fixed location, and explore both ideas with a calculator and a chart.
What you will learn
- Define housing cost burden and severe cost burden.
- Convert area median income (AMI) into the rent a household can afford.
- Explain why housing supply responds slowly to demand.
- Describe filtering and what it does and does not tell us.
Key terms
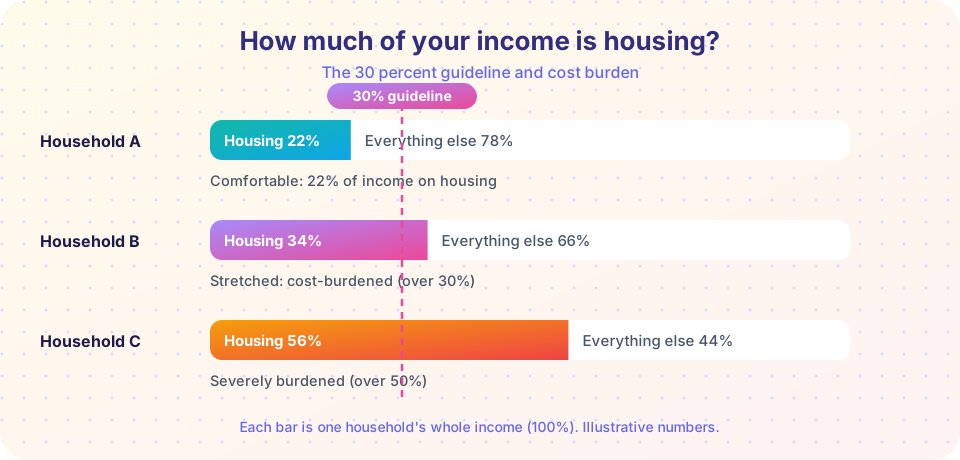
Cost burden: a household spends more than 30% of its gross income on housing costs. Severe cost burden: more than 50%.
Area median income (AMI): the income at which half of households in a region earn more and half earn less. Programs use percentages of it, such as 80% AMI.
Housing costs: rent or mortgage payments plus utilities (and, for owners, taxes and insurance).
Filtering: the process by which homes become cheaper as they age and are occupied by lower-income households over time.
Housing stock: all the homes that exist now, new and old.
The 30 percent rule and its limits
The most common yardstick is that a household should spend no more than 30 percent of gross income on housing. The rule traces back to United States federal housing policy: a 1969 amendment capped rents in public housing at 25 percent of income, and a 1981 change raised the share to 30 percent. Today agencies such as the US Department of Housing and Urban Development (HUD) use it to define a cost-burdened household, and use 50 percent for severely cost-burdened. Many other countries use similar thresholds, though the exact line differs.
The rule is useful because it is simple and comparable. If you know a household's income and housing cost you can classify it in seconds. A family earning 3,000 per month that pays 1,200 in rent spends 40 percent and is cost-burdened. But the rule has real limits, and good planners know them:
- It ignores everything except housing. A household in a cheap but remote neighborhood may spend little on rent and a great deal on cars and fuel. Some researchers therefore combine housing and transportation costs into a single measure, often with a 45 percent benchmark (the Housing + Transportation Affordability Index uses this idea).
- It treats all incomes alike. Thirty percent of a very high income leaves plenty of money for food and health care. Thirty percent of a very low income may not. At low incomes, the leftover dollars decide whether a family eats well, so some analysts prefer a "residual income" test: what is left after housing is paid.
- It depends on household size. A single person and a family of five with the same income face very different budgets.
Area median income: turning incomes into rents
Most affordable-housing programs are defined as percentages of area median income. HUD's usual bands are extremely low income (up to 30% of AMI), very low income (up to 50%), and low income (up to 80%). If the AMI is 80,000, then a household at 50% of AMI earns about 40,000 per year. At the 30 percent guideline, it can afford about 12,000 per year, or 1,000 per month, for housing.
That calculation is the heart of "affordable rent" in nearly every policy. Rent limits for subsidized apartments are usually set from AMI percentages rather than from market prices. The result is a clear target for developers and city agencies: if a unit must be affordable at 60% of AMI, its rent is capped near 30 percent of 60 percent of the AMI, divided by twelve months.
Why the housing market is unusual
A textbook market adjusts quickly: price rises, producers make more, price falls back. Housing breaks that pattern for several reasons.
- Location is fixed. You cannot ship a home from a cheap city to an expensive one. Demand for a particular place, such as a neighborhood with strong jobs and transit, cannot be met by building somewhere else.
- Supply is slow. From land purchase through approvals, financing and construction, a new building often takes several years. Demand can change in months.
- Supply is regulated. Zoning, building codes, parking requirements and review processes shape what can be built and how much. This is one reason the next lessons discuss zoning so often.
- Homes last for decades. The housing stock changes slowly: each year's new construction adds only a small percent to what already exists.
- Homes are both a place to live and an investment. Existing owners may benefit from rising prices, which affects local politics.
When demand grows faster than supply, prices and rents rise. Planners and economists generally agree that adding homes, especially in places with strong demand, tends to moderate price growth over time, although they debate how large and how fast the effects are, and where they show up. Studies of new buildings in some US cities find that new market-rate apartments can free up older units when their occupants move in, a "chain of moves" effect, though the benefit to the poorest households can be uneven.
Filtering: a useful idea with a catch
Older homes tend to become cheaper as they age, which is called filtering. A neighborhood built in the 1960s might house middle-income families at first and lower-income families fifty years later. Filtering explains why much of the affordable housing in many countries is simply old housing, not subsidized housing. But filtering is slow, it depends on a city's overall supply, and it can reverse: when demand surges, a formerly cheap neighborhood can gentrify, and its prices jump. That is why planners rarely rely on filtering alone for the lowest-income households.
Common misconceptions
"Affordable housing means low-quality housing." Affordable is a statement about price relative to income, not about the quality of construction. Many affordable homes are new and well built.
"If rents are high, it must be because developers are greedy." Developers respond to costs and rules as well as to demand. High land prices, construction costs, interest rates and limits on what can be built all push prices up. Profits matter, but they are only one factor.
"Cost burden measures poverty." It measures how much of income goes to housing, which can happen at many income levels, although severe burdens are most common among low-income households.
Try it
Use the calculator to test a household. Adjust income and rent and see the band change.
Now convert AMI levels into affordable rents with Python.
Press Run (or Ctrl + Enter) to see the result here.
Program input · what you'd type while the program runs
Type the answers before you press Run, one per line. Each time the program reads a line (with input()), it gets the next line from this box.
Check your understanding
Quick check · 5 questions
of 5 answered You scored / 5 · perfect!
-
1. A household earns 4,000 per month and pays 1,800 for housing. What is its classification?
1,800 / 4,000 = 45%, which is above 30% but not above 50%. -
2. If the AMI is 90,000, about how much rent per month is affordable at 60% of AMI using the 30% rule?
60% of 90,000 is 54,000. 30% of that is 16,200 per year, or 1,350 per month. -
3. Why does housing supply respond slowly to demand?
Fixed location, long construction time and regulation all slow supply. -
4. What does filtering describe?
Filtering is the gradual drop in a home's relative price and occupant income as it ages. -
5. Which is a limit of the 30 percent rule?
The rule looks only at housing share of income, ignoring other costs and household differences.
Summary
- Cost burden means spending over 30% of income on housing; over 50% is severe.
- AMI percentages turn incomes into affordable rents (30% of income divided by 12).
- Housing is slow to supply, fixed in place and shaped by regulation.
- Filtering helps over decades but is slow and can reverse.
- The 30% rule is a guide, not a full picture: transportation, household size and residual income matter.
Track your progress
Create a free account to tick off lessons and pick up where you left off on any device.
of Urban Planning lessons completed