


















Lesson 36 of 43 · Planning Practice and Data
Data, GIS and indicators
Learn how planners use census and survey data, GIS map layers and overlay analysis, population projections and indicators, and how to avoid common data mistakes.
Imagine being asked whether a new school should open in the north of town. Opinions will fly in every direction. Data cannot settle a values question, but it can answer many of the factual ones: How many children live nearby? Is the number growing? Which sites are free of flood risk and near a bus stop? What does the existing school's enrollment look like? Planners turn such questions into evidence, and then present the evidence so that decisions can be argued honestly.
This lesson covers the main kinds of planning data, how GIS (geographic information systems) combines them on a map, how to make a population projection, and where numbers can mislead.
What you will learn
- Name the main sources of planning data and their limits.
- Explain vector and raster data and what overlay analysis does.
- Compute density and other basic indicators.
- Make simple low, medium and high population projections.
- Recognize common data pitfalls.
Key terms
Census: a count of the whole population, usually every five or ten years, with basic questions about age, households and housing.
Survey sample: a smaller group questioned to estimate facts about the whole population, with a margin of error.
GIS: software and methods for storing, analyzing and mapping data tied to locations.
Vector and raster: two ways to store map data: vectors use points, lines and polygons; rasters use a grid of cells.
Indicator: a number that tracks progress toward a goal, such as the share of homes within 300 meters of a park.
Where planning data come from
Censuses give a full count at small areas but are infrequent. Between counts, planners use surveys such as the American Community Survey in the United States, which samples households every year and publishes estimates with margins of error; small areas can have wide margins, and ignoring them leads to false conclusions. Administrative records (building permits, property tax files, school enrollments, transit boardings, crash reports, utility connections) are collected for other purposes but reveal how the city changes. Sensors and new sources such as traffic counters, bike-share trips and satellite images fill gaps, but they raise privacy and bias questions: a smartphone-based dataset can underrepresent people without smartphones. Local knowledge from interviews and community mapping captures things no database holds, such as which crossing feels unsafe at night.
Always ask four questions of any dataset: Who collected it and why? What exactly does each number measure? Who or what is missing? How old is it?
How a GIS works
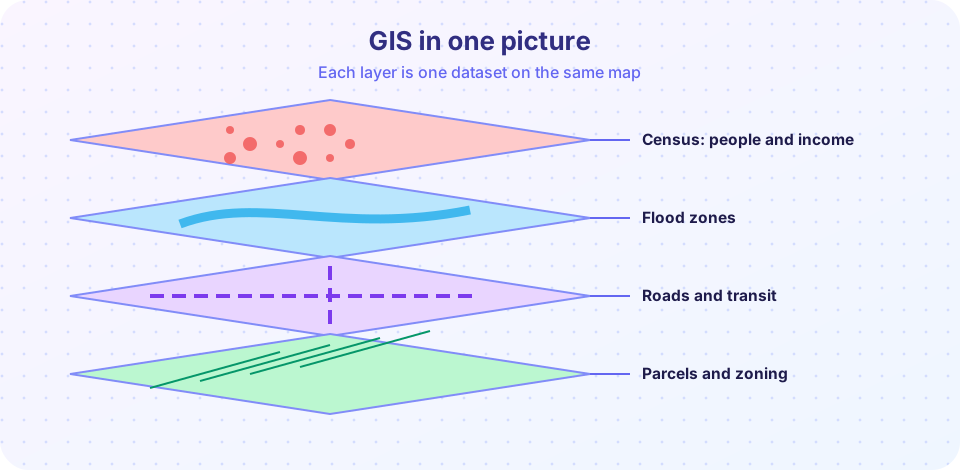
A GIS stores each dataset as a layer tied to coordinates on the Earth. Vector layers represent discrete things: points (bus stops), lines (roads, rivers) and polygons (parcels, census tracts, flood zones), each with a table of attributes. Raster layers cover space with a grid of cells, each holding a value, such as land elevation, tree cover or air temperature from a satellite.
The power of GIS lies in operations that combine layers:
- Overlay: stack layers and find where conditions coincide, for example parcels that are vacant, outside the flood zone and within 400 meters of a station.
- Buffer: draw a zone at a set distance from a feature, such as 300 meters around parks.
- Spatial join: attach data from one layer to another, such as adding the tract's median income to each school.
- Network analysis: measure distances along streets rather than straight lines, which produces more realistic walksheds.
Planners also need a basic understanding of map projections, because flattening a sphere distorts shape, area or distance. Using the wrong projection can make areas or distances wrong, so analysts choose one that fits the region and purpose.
Basic indicators
Indicators turn a goal into a number you can track. A few common ones:
- Population density: people divided by land area (people per hectare or per square kilometer).
- Dwelling units per hectare and floor area ratio (FAR): total floor area divided by lot area, a measure of building intensity.
- Jobs-housing balance: the ratio of jobs to homes in an area.
- Share of residents within a 10-minute walk of a park, a grocery store or a bus stop.
- Cost-burdened household share: introduced in the housing chapter.
- Traffic deaths per 100,000 residents, or per billion kilometers traveled.
An indicator is only useful if it is measurable, comparable over time and linked to a decision. Choose a small set rather than dozens.
Population projections
Planners must estimate how many people will live in an area in 10 or 20 years to size schools, water systems and housing. The simplest approach is a growth rate: P(t) = P0 × (1 + r)^t, where P0 is today's population, r the yearly growth rate and t the years. At a 2 percent annual growth rate, the doubling time is about ln 2 / ln 1.02, or roughly 35 years. More careful methods use the cohort-component approach: split the population into age and sex groups, age each group forward one step at a time, apply birth and death rates, and add migration. This captures things a single rate cannot, such as an aging population needing fewer schools and more care.
No projection is a prediction. Every one rests on assumptions about births, deaths and migration, and migration in particular can change quickly. Responsible planners publish a range, typically low, medium and high scenarios, and update them as new data arrive.
Pitfalls to avoid
- Ecological fallacy: assuming that a pattern across areas applies to each individual living there. A neighborhood with a high average income still contains low-income households.
- Modifiable areal unit problem (MAUP): results change depending on how boundaries are drawn. Combining small areas into larger ones can hide or create patterns.
- Averages that hide spread: a median household income says nothing about inequality inside the area; look at distributions.
- False precision: reporting 12,347 people when the margin of error is plus or minus 2,000.
- Correlation mistaken for cause: parks and high home prices go together, but the park may not cause the price.
- Privacy: location data can identify individuals; protect people by aggregating and limiting access.
Common misconceptions
"Data are neutral." Choices about what to measure, how to draw boundaries and which groups to count all shape the results.
"A map is an exact picture." Maps are models; they hide detail and carry the biases of their data.
"A projection says what will happen." It says what would happen under stated assumptions.
Try it
Overlay three layers on a toy grid. Each cell is scored for a possible new library site: outside the flood zone, near transit, and vacant. Turn criteria on and off to see how the best sites change. The map is invented.
Now project a population with three growth scenarios, and see how the range widens over time.
Press Run (or Ctrl + Enter) to see the result here.
Program input · what you'd type while the program runs
Type the answers before you press Run, one per line. Each time the program reads a line (with input()), it gets the next line from this box.
Check your understanding
Quick check · 5 questions
of 5 answered You scored / 5 · perfect!
-
1. What does a GIS overlay do?
Overlay stacks layers to answer questions that need several datasets. -
2. What is the main difference between vector and raster data?
Vector features are discrete shapes; rasters store values in cells. -
3. At 2% growth per year, about how long does a population take to double?
ln 2 / ln 1.02 is about 35 years. -
4. What is the ecological fallacy?
Group averages do not describe every member. -
5. Why publish low, medium and high projections?
Ranges show the effect of uncertainty about births, deaths and migration.
Summary
- Planning data come from censuses, surveys, records, sensors and local knowledge; always ask who is missing.
- GIS stores layers and combines them by overlay, buffer, spatial join and network analysis.
- Indicators should be measurable, comparable over time and tied to decisions.
- Projections are ranges based on assumptions, not predictions.
- Watch for the ecological fallacy, boundary effects, false precision and privacy risks.
Next: Chapter review
Track your progress
Create a free account to tick off lessons and pick up where you left off on any device.
of Urban Planning lessons completed