


















Lesson 31 of 43 · Sustainability and Resilience
Climate and urban form
See how city shape affects greenhouse gas emissions: density and car use, transit-oriented development, building efficiency, the 15-minute city and heat islands.
Two people with the same income and the same values can have very different carbon footprints simply because they live in different places. If your home, work, school and shops are within a short walk or a quick ride, you can live comfortably without a car. If they are scattered across a region, you may drive more than 30 kilometers every day. The shape of a city, which planners call urban form, quietly sets the menu of choices.
This lesson looks at where urban emissions come from, what research says about density and travel, what a compact and walkable pattern looks like, and how to weigh the evidence honestly, including the limits and the critiques.
What you will learn
- Identify the main sources of emissions in cities.
- Describe how density, mix of uses and transit affect travel.
- Explain transit-oriented development and the 15-minute city.
- Weigh the evidence on density and emissions, including limits.
- Compare commute emissions of different modes.
Key terms
Mitigation: actions that reduce greenhouse gas emissions.
Urban form: the physical pattern of a city: density, street layout, land uses and how they connect.
Transit-oriented development (TOD): compact, mixed-use neighborhoods built within walking distance of frequent public transit.
Embodied carbon: emissions from making and transporting building materials, released before a building is ever used.
Urban heat island: warmer temperatures in built-up areas than in nearby countryside.
Where city emissions come from
Greenhouse gas emissions in cities come mainly from three sources: buildings (heating, cooling, lighting and appliances, mostly through electricity and fuel burned on site), transport (cars, trucks, buses, ships and planes) and waste and industry. In many cities, buildings and transport together produce the large majority of emissions. A frequently quoted figure says cities are responsible for roughly two-thirds or more of global energy-related emissions, although the exact share depends on how researchers draw the boundary between urban and rural and where they count emissions from electricity and goods made elsewhere.
Different cities have different profiles. A city powered mostly by coal has high building emissions even if its people walk everywhere. A city in a mild climate with clean electricity may have transport as its biggest source. A planner's first step is therefore a greenhouse gas inventory that lists emissions by sector, because the right priorities follow from the numbers.
Density, distance and driving
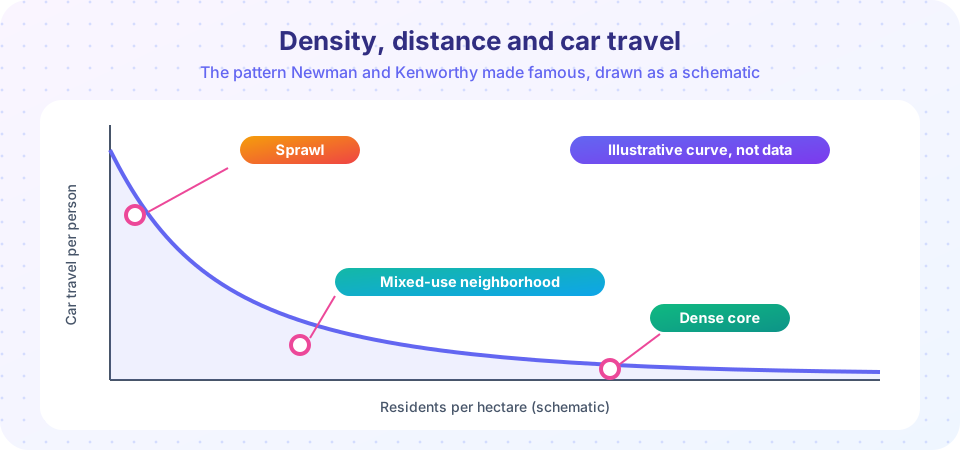
In 1989, the researchers Peter Newman and Jeffrey Kenworthy compared gasoline use and urban density in 32 cities worldwide and found a strong pattern: cities with more residents per hectare used much less fuel per person, with sprawling US cities at one extreme and dense Asian cities at the other. Their work has been influential and has been repeated with more data. Later studies find that density is associated with fewer and shorter car trips, but the relationship is not simple, and critics raise several points:
- Income and fuel prices matter. Richer households and countries drive more, and cheap fuel encourages driving at any density.
- Density alone is not enough. What matters is the combination of density, diversity (a mix of homes, jobs and services), design (walkable streets), destination accessibility (how many jobs are reachable) and distance to transit. Researchers sometimes call these the "five Ds."
- Self-selection. People who like walking may choose dense neighborhoods, so some of the difference reflects preferences, not only the place. Careful studies try to control for this and still find that urban form has an effect, though smaller than raw comparisons suggest.
The message for planners is that compact, mixed-use, well-connected places make low-carbon choices easy, and sprawling, separated land uses make driving the only practical option.
Transit-oriented development and the 15-minute city
Transit-oriented development places homes, jobs, shops and public space within about a 10-minute walk of a station. The idea works because transit needs riders to run frequently, and riders need destinations at both ends. Cities such as Copenhagen (its "finger plan" guided growth along rail lines from the 1940s) and Tokyo (where private railways develop land around stations) have long used the model. Planners also try to prevent displacement by pairing TOD with affordable-housing requirements.
The 15-minute city, popularized by the urbanist Carlos Moreno in 2016 and later championed by the mayor of Paris, proposes that residents should meet most daily needs within a 15-minute walk or bike ride. Supporters argue it reduces car dependence, supports local business and builds community. Critics raise valid concerns: it should not be read as a ban on travel, it may not fit every region, and poor neighborhoods may lack the services to make it real without investment. The idea is best treated as a planning target, not a rigid rule.
Buildings, materials and energy
Beyond travel, planners influence emissions through buildings. Compact buildings with shared walls lose less heat than detached houses. Efficient codes, heat pumps, rooftop solar and connection to clean electricity cut operational emissions. But constructing buildings also releases embodied carbon from steel, cement and other materials, so reusing and retrofitting existing buildings can often be better for the climate than demolishing and rebuilding. Trees and cool roofs lower cooling demand and reduce the urban heat island.
Common misconceptions
"Dense means high-rise." Many dense, low-carbon places are mid-rise: four to six stories with narrow streets and shops on the ground floor.
"Electric cars solve everything." Electric vehicles cut tailpipe emissions, but they do not reduce congestion, road space, or the dangers of high speeds, and making batteries has its own footprint. Planners treat them as one part of the solution alongside transit, walking and cycling.
"Compact cities are only about emissions." Compactness also affects land use, infrastructure costs and public health, and it must be balanced against housing costs and green space.
Try it
First check how many everyday needs a household can reach within 15 minutes. Enter your own times, or experiment with a different neighborhood.
Now compare the yearly emissions of a daily commute. The emission factors are rounded illustrative values; real figures vary by vehicle, fuel, electricity mix and occupancy.
Press Run (or Ctrl + Enter) to see the result here.
Program input · what you'd type while the program runs
Type the answers before you press Run, one per line. Each time the program reads a line (with input()), it gets the next line from this box.
Check your understanding
Quick check · 5 questions
of 5 answered You scored / 5 · perfect!
-
1. Which are the main sources of urban emissions?
Energy used in buildings and in moving people and goods dominates most city inventories. -
2. What is the main finding of Newman and Kenworthy (1989)?
They found a strong association between density and lower per-person gasoline use. -
3. Why is density alone not enough?
The 'five Ds' work together to enable low-carbon travel. -
4. What is embodied carbon?
Embodied carbon is released before a building is used. -
5. A 10 km commute each way, 230 days, is how many km per year?
10 km x 2 trips x 230 days = 4,600 km.
Summary
- Buildings and transport are the biggest sources of urban emissions.
- Density, diversity, design, destinations and transit together shape travel; self-selection and income complicate the evidence.
- Transit-oriented development and the 15-minute city are targets, not rigid rules.
- Reusing buildings can save embodied carbon.
- Electric vehicles help but do not replace good urban form.
Next: Hazards and adaptation
Track your progress
Create a free account to tick off lessons and pick up where you left off on any device.
of Urban Planning lessons completed