


















Lesson 37 of 43 · Planning Practice and Data
Chapter 8 review: Planning practice and data
Review chapter 8 with a one-picture summary, a recap table of the planning cycle, participation and GIS data, and a ten-question quiz mixing all the lessons.
Good planning rests on three legs: a clear process, genuine participation and honest data. A weakness in any one undermines the others. A transparent process with biased data produces confident errors; accurate data with no public involvement produces plans nobody owns; and lively meetings without evidence produce arguments, not decisions. Use this page to check that all three legs are strong in your mind.
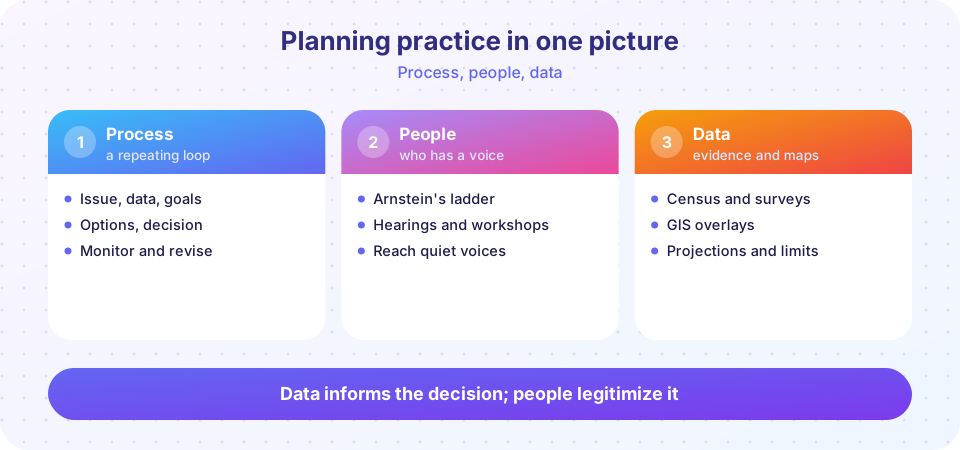
The chapter in one table
| Idea | What to remember | Lesson |
|---|---|---|
| Planning cycle | Define, gather data, set goals, design options, evaluate, act and monitor | Overview |
| Comprehensive plan | Vision, conditions, goals and objectives, policies, implementation | Plans |
| Arnstein's ladder | Eight rungs: from manipulation to citizen control | Plans |
| Method bias | Hearings favor older, organized, home-owning residents | Plans |
| Scoring matrix | Weighted criteria make trade-offs visible; weights are values | Plans |
| GIS | Layers, overlay, buffer, spatial join, network analysis | Data |
| Indicators | Measurable, comparable, tied to decisions | Data |
| Projections | Ranges from assumptions; doubling time = ln 2 / ln(1 + r) | Data |
| Pitfalls | Ecological fallacy, MAUP, false precision, privacy | Data |
Practice habits of good planners
Experienced planners share a few habits. They write down their assumptions and show them to others. They look for the people who are not in the room and go to them. They present options rather than a single answer, so decision makers can see trade-offs. They label uncertainty plainly, and they return to the numbers after the project is built to see what actually happened. In the next chapter you will practice all of these in projects and case studies.
Common mistakes to avoid
- Skipping the problem definition. Teams often jump to solutions. If you cannot state the problem in one sentence with a number, you are not ready to design options.
- Collecting data with no question. More data is not better data. Decide what decision the data will inform before you collect it.
- Treating public comment as a vote. Comments tell you what people think and why, but a self-selected sample is not a representative poll. Compare participants with the census to see who is missing.
- Hiding assumptions. Projections, scoring matrices and maps all rest on choices. Write them down and show how results change if they change.
- Forgetting to monitor. Without a follow-up, a plan cannot learn from its results, and the cycle never closes.
A sample reasoning chain
Suppose a city asks whether to add a protected bike lane to a main street. A strong answer starts by defining the problem (crash data show injuries to cyclists), gathers evidence (crash counts, traffic volumes, a map of existing routes), sets measurable objectives (reduce serious injuries, increase bike trips), compares at least two options with an open scoring matrix, and engages shop owners, residents and people who ride, using methods that reach people who rarely attend hearings. After the lane is built, the city counts crashes and trips and publishes the results. If the numbers do not improve, it adjusts. Every step from the chapter appears in this short story.
Check your understanding
Quick check · 10 questions
of 10 answered You scored / 10 · perfect!
-
1. Which step follows 'Evaluate and decide' in the planning cycle?
After a decision comes implementation and monitoring, which feeds the next cycle. -
2. A goal says 'a safe city'; an objective says 'cut traffic deaths in half in ten years.' What makes the objective different?
Objectives are specific and measurable. -
3. Officials publish the final plan online with no way to comment. On Arnstein's ladder this is
One-way communication is informing, a tokenism rung. -
4. Which method best reaches people who cannot attend evening hearings?
Mixing methods and meeting people where they are widens participation. -
5. In a scoring matrix, who should set the weights?
Weights express values, so they should be transparent and tested. -
6. What does a GIS buffer do?
Buffers mark areas within a distance, like 300 m around parks. -
7. A town of 50,000 grows 2% a year. About how many people after 10 years? (1.02^10 is about 1.219)
50,000 x 1.219 is about 60,950. -
8. Why are margins of error important for small-area survey estimates?
Small samples have wide margins, so differences may not be real. -
9. Which is an example of the ecological fallacy?
Area averages do not describe every individual. -
10. Why publish low, medium and high projections?
Scenarios show a range of plausible futures.
Summary
- Planning is a cycle supported by open process, participation and data.
- Ladders, methods and matrices help you judge and improve engagement.
- GIS and indicators turn questions into evidence; projections show ranges.
- Name the limits of your data and your methods.
Track your progress
Create a free account to tick off lessons and pick up where you left off on any device.
of Urban Planning lessons completed