


















Lesson 38 of 43 · Projects and Practice
Project: plan a neighborhood
A guided mini-project: program a six-hectare site, test density and park area with calculators, score design options, plan engagement and present your plan.
You have learned the vocabulary, the history and the tools. Now it is time to use them together. In this project you will plan a small new neighborhood on a vacant six-hectare site next to a bus corridor. The site is invented, so you will not find the "right answer" in a textbook, but you can compare your plan against clear tests: Does it fit the numbers? Does it serve the goals? Can you explain the trade-offs?
Treat this lesson as a workshop. Read the brief, run the calculators, then write a one-page summary of your plan. A teacher, friend or study group can then critique it using the checklist at the end.
What you will learn
- Turn goals into a site program with numbers.
- Calculate homes, residents and park space from land-use shares.
- Check a plan against simple rules of thumb from earlier chapters.
- Compare design options with a scoring matrix.
- Present a plan with its assumptions and limits.
Key terms
Site program: a list of what a project must provide (homes, parks, shops, streets) with target quantities.
Gross and net area: gross area is the whole site; net area is what remains after subtracting streets, parks and other public land.
Floor area ratio (FAR): total floor area divided by the area of the lot.
Unit mix: the range of home sizes, from studios to family apartments.
Assumption: a stated guess, such as the average household size, that your numbers depend on.
The brief
A city owns a vacant site of six hectares (60,000 square meters). A frequent bus line runs along its north edge, and a stream with a floodplain lies along the south edge. The council wants a neighborhood with these goals:
- Homes for a mix of incomes, with at least 15 percent affordable to households at 60 percent of area median income.
- Low-carbon travel: most daily needs reachable on foot or by bike, and a safe link to the bus line.
- Public space: a park within a five-minute walk of every home, and tree canopy along the streets.
- Resilience: keep new buildings out of the flood zone and handle stormwater on site.
- A fair process: residents of nearby streets must be consulted before the council votes.
Notice that these goals draw on every chapter. Housing and equity give the affordable-home target; the street and park lessons shape the blocks and the green network; sustainability and resilience set the flood rule and the travel goals; and practice gives the process.
Step 1: set objectives with indicators
Turn each goal into a measurable objective. For example, goal 3 becomes "100 percent of homes within 300 meters of a park, measured along streets." Write one indicator per goal in a table with a target and a data source. Remember that an indicator should be measurable, comparable and linked to a decision. Keep the list short: five to eight rows are enough.
Step 2: program the site
Start from the gross area and subtract what is not buildable. A reasonable first pass allocates about 25 percent of the gross site to streets, paths and utilities, and about 15 percent to parks and stormwater features, leaving about 60 percent as net buildable land. Choose a floor area ratio for that land: a FAR of about 1.5 to 2 means buildings of three to five stories on typical lots, a form that supports shops and transit without towers. Then decide how much floor area goes to homes and how much to shops, offices, a school or a library. Divide the residential floor area by the average home size to estimate the number of homes, and multiply by average household size to estimate residents.
Use the calculator below. Change the numbers to see how density, residents and park space per person respond. All inputs are assumptions you should state in your summary.
Press Run (or Ctrl + Enter) to see the result here.
Program input · what you'd type while the program runs
Type the answers before you press Run, one per line. Each time the program reads a line (with input()), it gets the next line from this box.
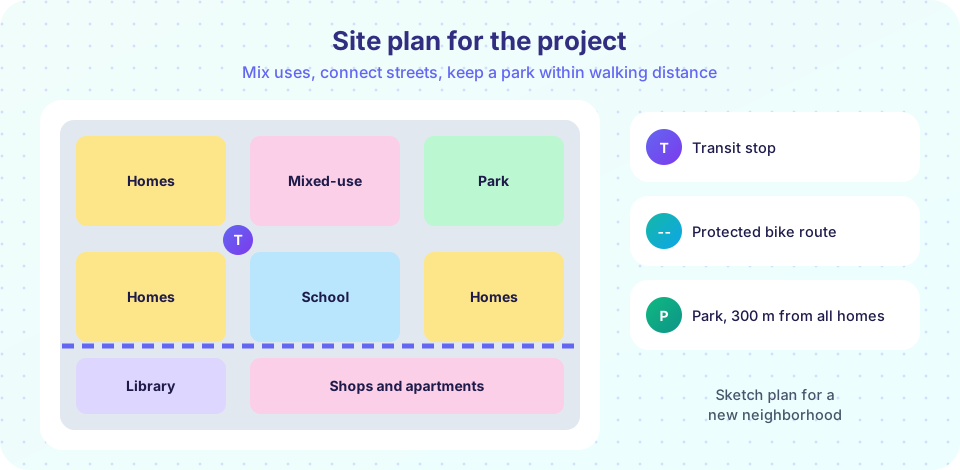
Step 3: lay out blocks, streets and the green network
Now sketch the layout on paper or a grid. Apply the rules you know:
- Streets: short blocks (about 80 to 120 meters on a side) give more route choices and more corners for shops. Use the 8-80 test for each street: could an 8-year-old and an 80-year-old cross it safely?
- Mixed uses: put shops and services on the ground floor along the bus corridor and the main street; place homes above and on quieter streets.
- Park and green network: place the park so that every home is within about 300 meters, link it to the stream corridor, and plant street trees to approach 30 percent canopy over time.
- Flood rule: keep buildings above the flood level shown on the map. Use the floodplain as a park, wetland or sports field that can flood harmlessly.
- Stormwater: reduce runoff with permeable paving, rain gardens and green roofs. Remember that lower runoff coefficients shrink peak flows.
Use the interactive widget to test your land budget against the rules of thumb above. It is a teaching tool, not a design program.
Step 4: compare options and engage people
Produce two or three alternative layouts, for example: (A) a compact plan with a large central park, (B) a plan with several small parks and more street frontage, and (C) a lower-density plan with more yards. Score them with a weighted matrix like the one in the previous chapter. Pick criteria that match the goals (affordability, travel, public space, resilience, cost) and set weights openly. Then plan engagement: who lives nearby, who will live in the new homes but is not here yet, and how will you reach them? List at least three methods that reach different groups, and decide which rung of Arnstein's ladder you are aiming for.
Step 5: present your plan
Write a one-page summary containing: the site and goals; your key numbers (homes, residents, density, affordable homes, park area per person); a small sketch; the results of the scoring matrix; your engagement plan; and a short limits paragraph that names your assumptions and what you did not model, such as detailed traffic, construction costs and soil conditions. Honesty about limits makes a plan more credible, not less.
Self-review checklist
- Do the numbers add up, and are all assumptions stated?
- Is every home within about 300 meters of a park?
- Are at least 15 percent of homes affordable at 60 percent of AMI?
- Are buildings outside the flood zone, with stormwater handled on site?
- Could an 8-year-old and an 80-year-old use every street?
- Did you compare at least two options and explain the trade-offs?
- Does your engagement plan reach people who usually miss meetings?
Common misconceptions
"There is one correct plan." Several layouts can meet the goals; the task is to justify the one you pick.
"More density always means more traffic." In a walkable, well-served neighborhood, density can come with fewer car trips per person.
"Numbers replace judgment." Calculators check feasibility; values decide priorities.
Check your understanding
Quick check · 4 questions
of 4 answered You scored / 4 · perfect!
-
1. A 6 ha site has 25% streets and 15% park. How much land is net buildable?
6 ha is 60,000 m2; 60% of that is 36,000 m2. -
2. What does FAR measure?
Floor area ratio compares total floor area with lot area. -
3. Why produce more than one design option?
Options make trade-offs visible. -
4. Why include a 'limits' paragraph?
Honest limits help readers judge how far to trust the plan.
Summary
- Turn goals into objectives with indicators and a site program with numbers.
- Subtract streets, parks and flood areas before estimating homes and residents.
- Test the layout against rules of thumb: short blocks, 300 m to a park, outside the flood zone.
- Compare options with a scoring matrix and plan inclusive engagement.
- Present assumptions and limits honestly.
Track your progress
Create a free account to tick off lessons and pick up where you left off on any device.
of Urban Planning lessons completed